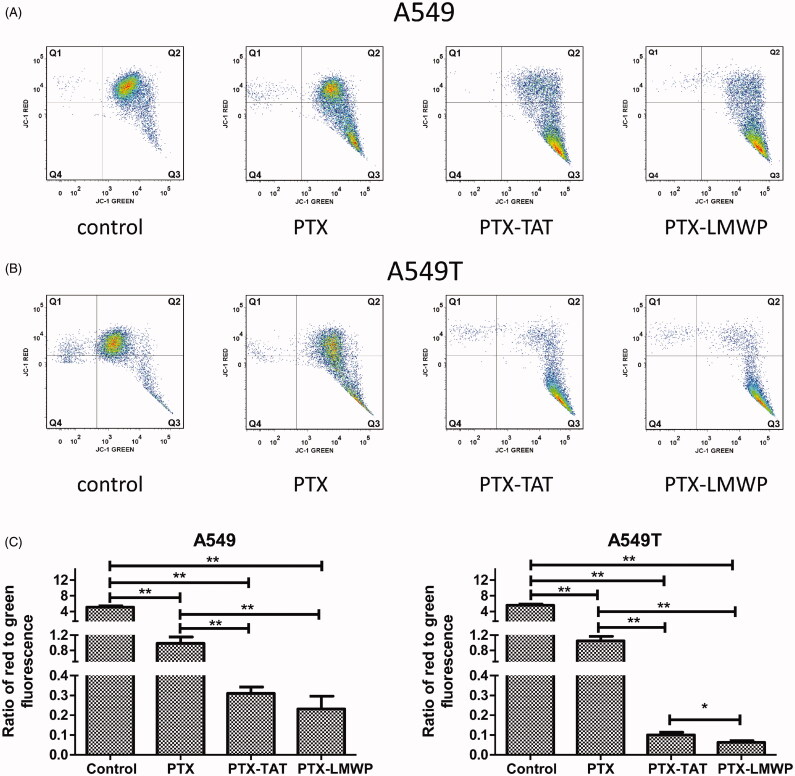
Figure 4.
JC-1 forms and Δψm values of A549 and A549T cells. All cells were exposed to drugs at 10 μM for 48 h. (A) The distribution of different JC-1 forms in A549 cells. (B) The distribution of different JC-1 forms in A549T cells. (C) Ratio of red to green fluorescence in A549 and A549T cells. *p < 0.05; **p < 0.01.

