
Figure 5.
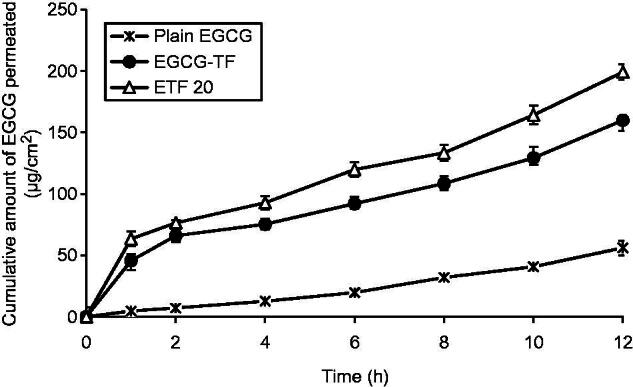
In vitro skin permeation profiles of plain EGCG solution, transfersomes containing EGCG and transfersomes containing EGCG and HA (ETF20). Results are presented as mean ± SD (n = 3).
Official websites use .gov
A
.gov website belongs to an official
government organization in the United States.
Secure .gov websites use HTTPS
A lock (
) or https:// means you've safely
connected to the .gov website. Share sensitive
information only on official, secure websites.
In vitro skin permeation profiles of plain EGCG solution, transfersomes containing EGCG and transfersomes containing EGCG and HA (ETF20). Results are presented as mean ± SD (n = 3).