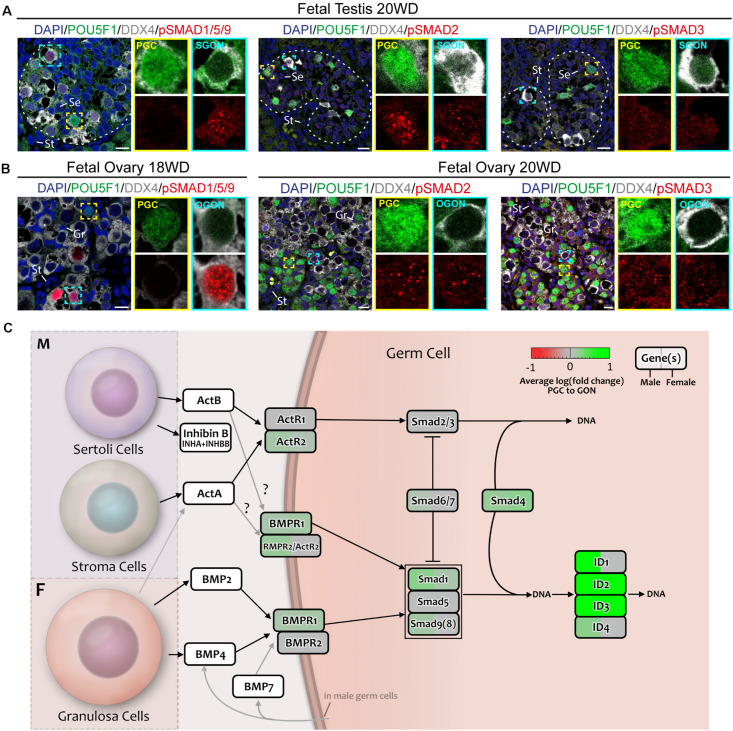
FIGURE 8.
Analysis of TGFβ/BMP signaling in fetal gonads by immunostaining for key (phosphorylated) pathway effectors. (A,B) Immunofluorescence of phosphorylated (p)-SMAD1/5/9 and pSMAD2/3 with DDX4 and POU5F1 in fetal testis of 20 WD (A) and fetal ovary of 18 WD (B). In the testis, pSMAD1/5/9 is localized in SGONs, whereas in the ovary, it is localized to a subset of OGONs. In contrast, pSMAD2 and 3 are present in all cell types of both the ovary and testis. Yellow boxes indicate zoom-in of a PGC, and cyan boxes indicate zoom-in of a GON. Se, St, and Gr annotate Sertoli, stromal, and granulosa cells, respectively. Scale bar indicates 10 μm. (C) A schematic model of active signaling BMP/TGFβ axes in germ cells representing a combination of results from CellphoneDB analysis and differentially expressed gene analysis. Genes upregulated in GONs are depicted in green, while those upregulated in PGCs are depicted in red.

