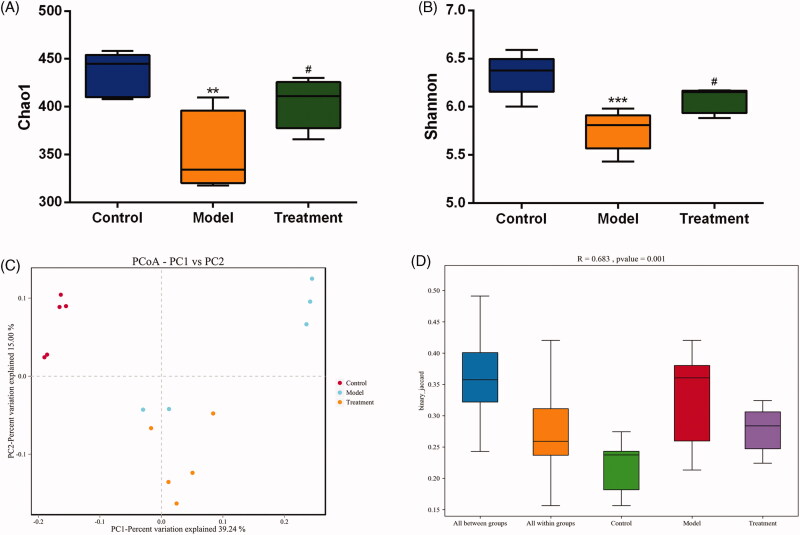
Figure 4.
Microbial diversity analysis. (A) Chao1 index. (B) Shannon index. (C) PCoA (Principal coordinates analysis). Dots represent all samples; Different colors represent different groups; X-axis and Y-axis represent two eigenvalues that cause largest difference between samples, they represent the degree of major influence in the form of a percentage. The closer the distance, the higher is the similarity. (D) ANOSIM (analysis of similarities). Y-axis represents Beta distance; The box above 'All between groups' represents the Beta distance data of samples between all groups, while the box above 'All within groups' represents the Beta distance data of samples within all groups. The box below represents the Beta distance data of samples within different groups. The closer the R value (obtained from ANOSIM analysis) is to 1, the higher the difference between groups is than that within groups; the smaller the R value is, the less significant difference is between them; P value less than 0.05 indicates high reliability of the test. n = 5 rats per group. **p < 0.01, ***p < 0.001 vs. control, p < 0.05 vs. model.#

