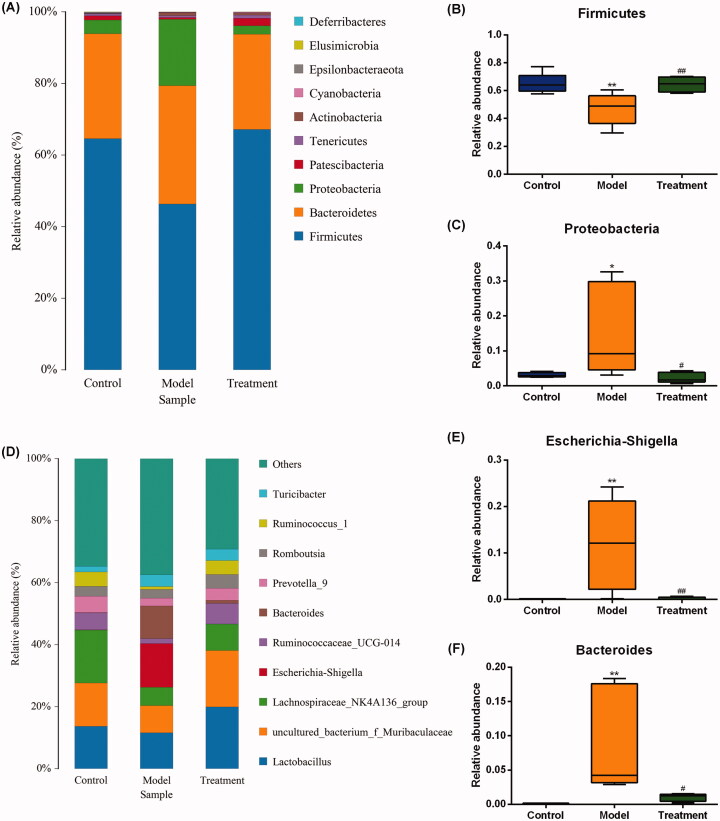
Figure 5.
Relative abundance of gut microbiota at phylum (A) and genus (D) levels. One color represents one specie, and the length of the color block presents the relative richness proportion of the species. Abundance of the phyla (B) Firmicutes. (C) Proteobacteria. Abundance of the genera (E) Escherichia-Shigella. (F) Bacteroides. n = 5 rats per group. *p < 0.05, **p < 0.01 vs. control, p < 0.05, p < 0.01 vs. model.###

