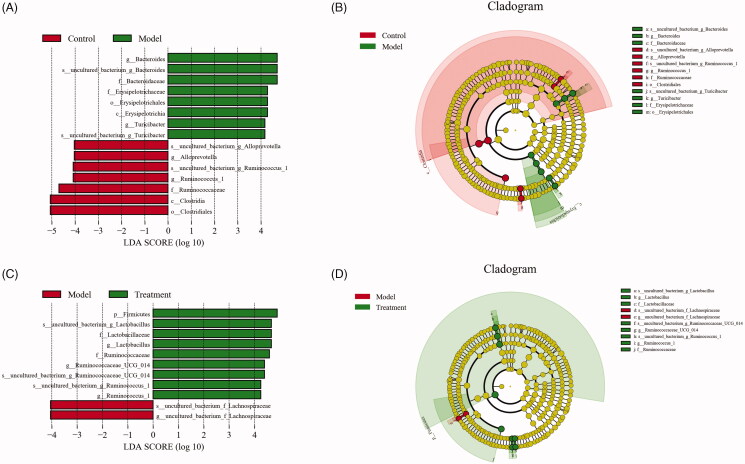
Figure 6.
Linear discriminant analysis effect size (LEfSe) and cladograms were applied to identify the microbial taxa with different abundances in three groups. (A, C) The figures show the species whose LDA score is higher than the set value (the default is 4.0). The length of the histogram represents the impact of different species (i.e., LDA Score), different colors represent species in different groups. (B, D) In the cladograms, circles radiating from the inside to the outside represent the different classification ranks from the phylum to the species. Each small circle represents a distinct taxon at the corresponding taxonomic level, with the diameter positively correlated with the relative abundance. The species with no significant difference are colored by yellow and biomarkers are colored based on different groups. Red and green dots represent the core bacterial populations of the respective groups.

