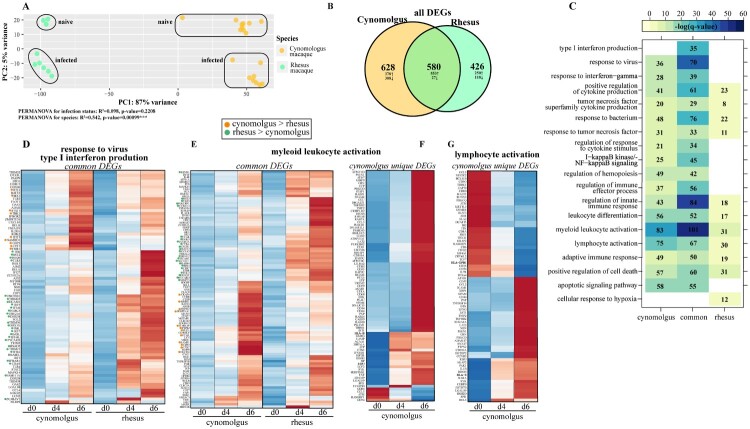
Figure 1.
Bivariate analysis identifies species-specific transcriptomes prior to and following infection. (A) Principal component analysis of cynomolgus or rhesus macaques uninfected or infected with EBOV-Makona Guinea C07. (B) Venn diagram of DEGs detected in infected macaque species (4 and 6 days post infection) relative to uninfected counterparts. (C) GO enrichment depicting functional enrichment of DEGs found in Figure S1E using Metascape. The colour intensity represents the statistical significance, as shown by the negative log of the FDR-adjusted p-value (-log(q-value)), with the range of colours based on the GO terms with lowest and highest -log(q-value) values for the entire set of GO terms. Numbers of DEGs enriching to each GO term per column are represented in each box; blank boxes represent no statistical significance. Gene expression heatmaps representing DEGs from GO terms found in part C: (D) “response to virus” and “type I interferon production,” (E,F) “myeloid leukocyte activation” and (G) “lymphocyte activation.” Heatmaps represent DEGs either common to both or unique to one species. Each column represents the median of the normalized rpkm of samples. Range of colours is based on scaled and centred rpkm values of the represented DEGs. Red represents upregulated; blue represents downregulated. DEGs expressed to a greater extent in cynomolgus (orange) or rhesus (green) macaques are coloured (two-tailed T test).

