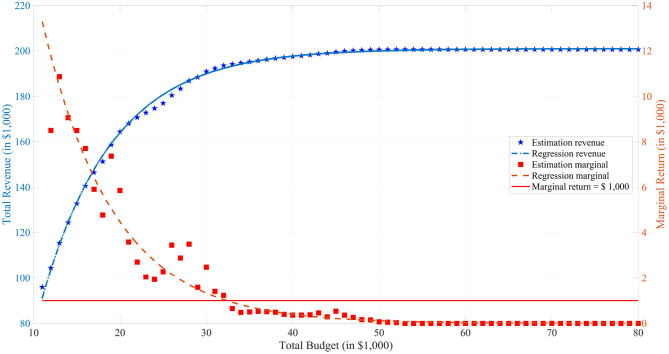
Figure 5.
Profits and Budgets. In the figure, the blue pentagrams represent the estimation results from simulations and the blue curve represents a nonlinear regression with model y = a1 + a2 × exp(a3x) for the estimation. The red squares represent the difference between the adjacent estimations and the red curve represents the derivative of the expected total revenue curve. The red horizontal line is the marginal return is equal to one unit increment of total budget, which is $1,000.

