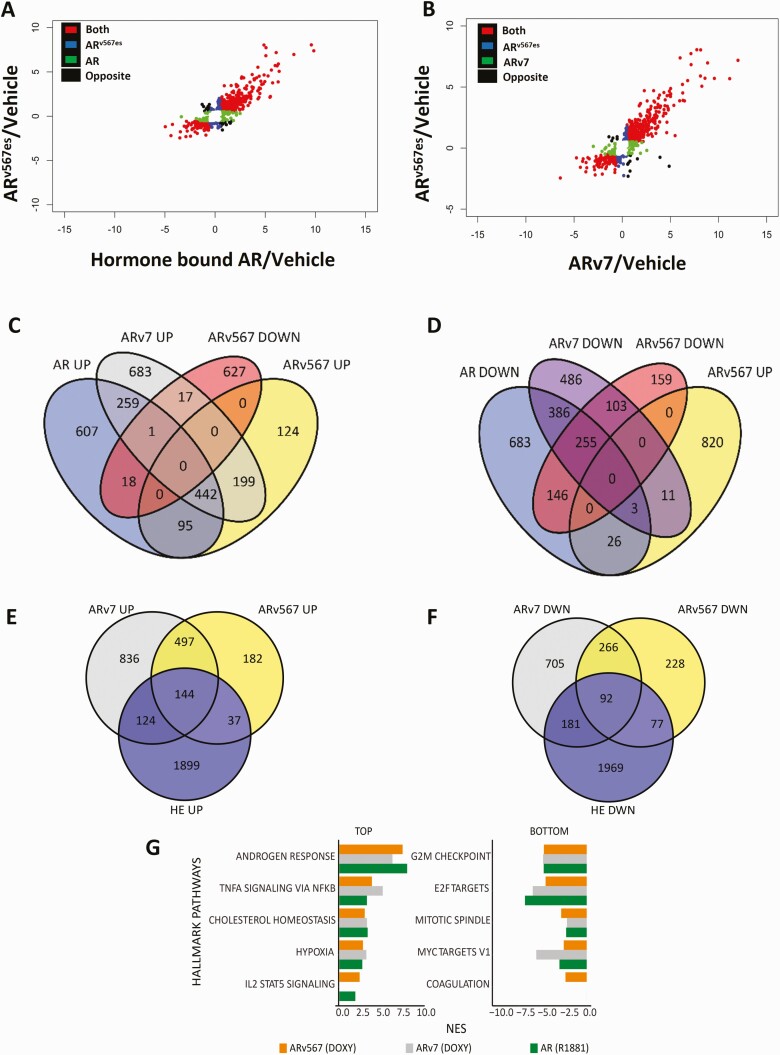
Figure 2.
Common and unique gene targets of AR and its splice variants identified by RNA-sequencing. (A) Scatter plot of the log2 fold change showing genes regulated by ARv567es and AR in the same direction, in the opposite direction, and genes unique for each isoform compared to vehicle controls. (B) Scatter plot of the log2 fold change showing genes regulated by ARv567es and ARv7 in the same direction, the opposite direction and unique target genes for each isoform compared to vehicle controls. (C) Venn diagram depicting numbers of genes commonly or uniquely upregulated by the 3 isoforms: AR, ARv7, and ARv567es. (D) Venn diagram depicting numbers of genes commonly or uniquely downregulated by all 3 isoforms: AR, ARv7 and ARv567es. (E) Venn diagram depicting the overlap of genes upregulated by ARv567es or ARv7 with the 22Rv1 data set from He et al. (24). (F) Venn diagram depicting numbers of genes downregulated by ARv567es or ARv7 with 22Rv1 data set from He et al. For these analyses, only genes with fold change exceeding 1.5× and adjusted P ≤ .05, compared with vehicle treatment were included. (G) The 5 Hallmark pathways most upregulated or downregulated by ARv567es (based on the normalized enrichment score/NES; FDR <0.05). For comparison, we provide the NES for the same pathways (when significantly enriched) regulated by AR and ARv7.

