Figure 5.
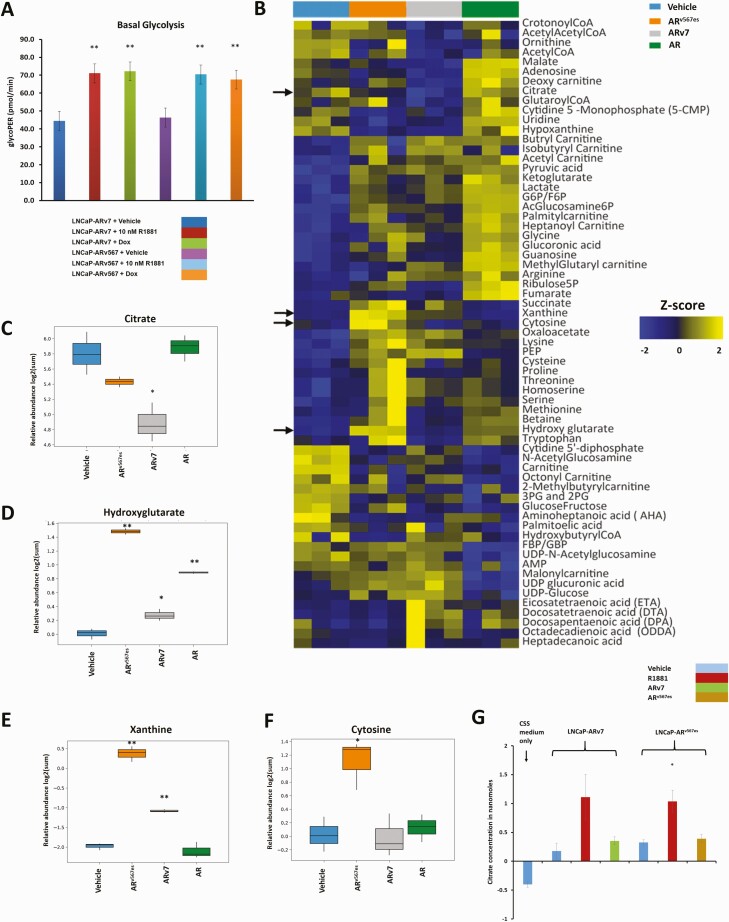
Metabolic differences between the actions of AR and the variants. (A) The basal rate of glycolysis was determined using LNCaP-ARv7 and LNCaP-ARv567es cells treated with vehicle, 10 nM R1881, 20 ng/mL Dox (LNCaP-ARv7), or 30 ng/mL Dox (LNCaP-ARv567es) for 24 hours in 10% CSS medium measured using the Seahorse platform. (B) Heat map showing Z scores for metabolites whose levels were changed as a result of the action of AR and its variants. LNCaP empty vector cells treated with vehicle (0.1% ethanol) or 10 nM R1881 were compared with an equal number of LNCaP-ARv7 cells treated with 20 ng/mL Dox or LNCaP-ARv567es cells treated with 30 ng/mL Dox for 48 hours in 10% CSS media. Three biological replicates from 3 independent experiments were used. Arrows indicate metabolites shown in subsequent box plots. Relative abundance (log2 scale of the peak area of the metabolite normalized to the internal standard) of (C) citrate, (D) hydroxyglutarate, (E) xanthine, and (F) cytosine from the experiment in Fig. 5B. Comparisons were performed between each of the 3 isoforms and vehicle, respectively. (G) Measurement of citrate secreted into the medium by LNCaP-ARv7 and LNCaP-ARv567es cells in CSS medium, treated with vehicle, 10 nM R1881, 20 ng/mL Dox (LNCaP-ARv7), or 30 ng/mL Dox (LNCaP-ARv567es) for 48 hours. Average of 3 independent experiments is shown. (t-test comparison with respect to vehicle-treated cells, *P < .05, **P < .01)

