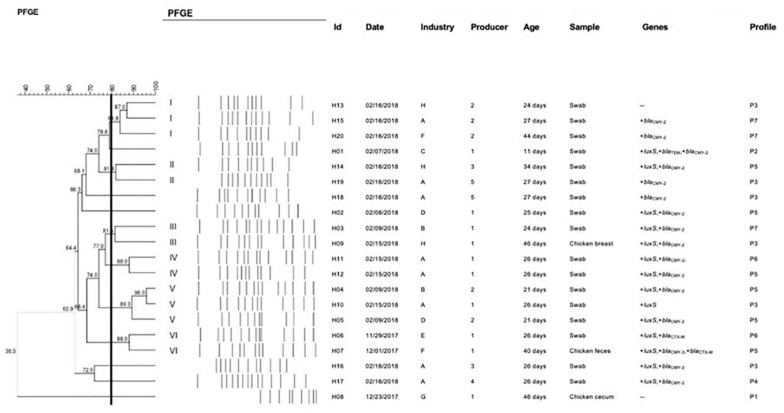
FIGURE 1.
Comparative dendrogram of 20 SH strains, constructed from PFGE results considering the isolation site, date of collection, and the presence or absence of specific genes and antimicrobial resistance, using the Dice similarity coefficient with 1.5% tolerance and UPGMA method with 0.80% optimization. I-VI, pulsotypes; Id, Identification. Genes: only those that showed differences between the strains. Profile: antimicrobial resistance profile (P1-P7; Table 1).

