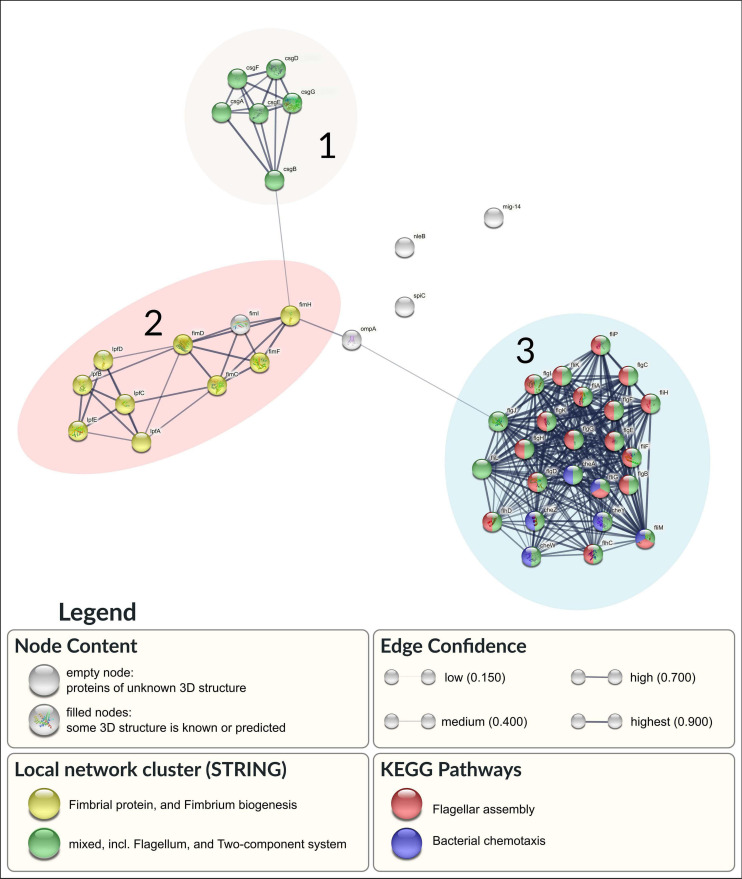
FIGURE 5.
Association network in STRING of the 44 selected proteins. Network nodes represent proteins. Proteins with enriched pathways are colored by red (Flagellar assembly) and blue (Bacterial chemotaxis). Additional node clustering is highlighted in yellow (Fimbria biogenesis) and green (Flagellum and Two-component system). Edges represent predicted protein-protein association with specific confidence score, according to its thickness.

