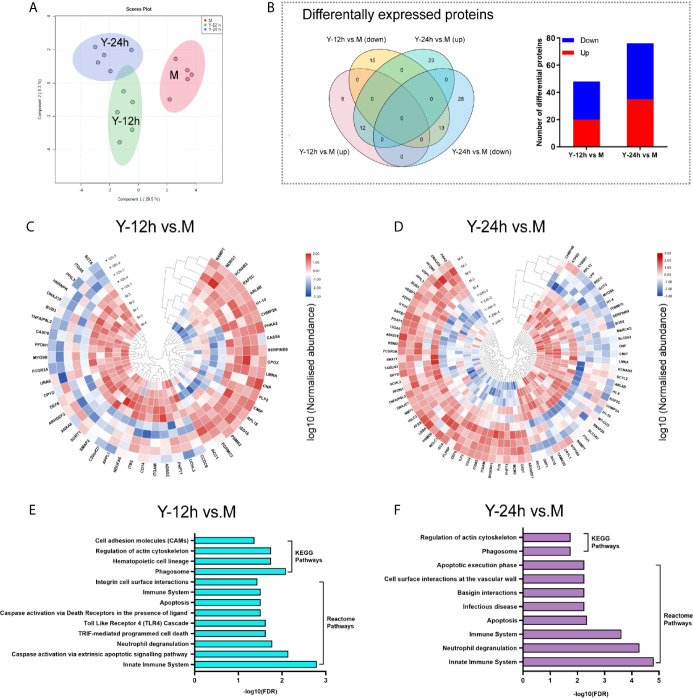
Figure 2.
Landscape of proteome analyses. (A) Principal component analysis (PCA) of unstimulated monocytes (M) and monocytes stimulated with heat-killed C. albicans for 12 h (Y-12 h) and 24 h (Y-24 h) (n = 5). (B) Proteins differentially expressed in monocytes after 12 h and 24 h stimulation by heat-killed C. albicans versus M group were displayed in Venn diagrams. Bar graph shows the number of up- (red) and down-regulated (blue) proteins. (C, D) Hierarchical clustering analysis of differential proteins between the Y-12 h or Y-24 h and M group with a P < 0.05 (Student’s t-test). Normalized abundances of proteins were logarithmic transformed. (E, F) Pathway analysis of the differentially expressed proteins in monocytes stimulated by heat-killed C. albicans.

