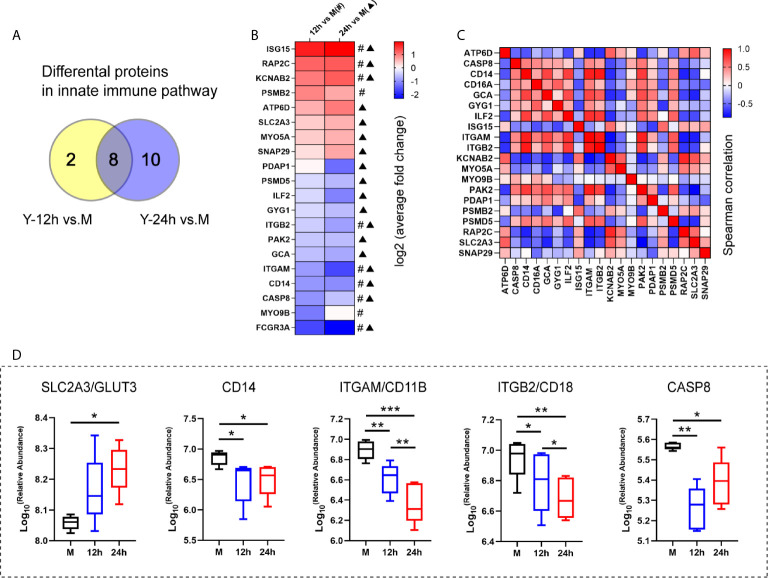
Figure 4.
The analysis of the innate immune pathway-related proteins. (A) Venn diagrams depict the differential proteins in innate immune pathway after 12 h and 24 h stimulation by heat-killed C. albicans versus the M group. (B) The average fold changes of 20 differential proteins for those significantly regulated in at least one comparison group (Y-12 h versus M: # or Y-24 h versus M: ▲) were analyzed. The fold changes of proteins were logarithmic transformed. (C) Correlation matrix of innate immune pathway-related proteins. (D) Selected the up-regulated GLUT3 and down-regulated (ITGAM/CD11B, ITGB2/CD18, CD14 and CASP8) in the innate immune pathway are shown. ***P < 0.001; **P < 0.01; *P < 0.05.

