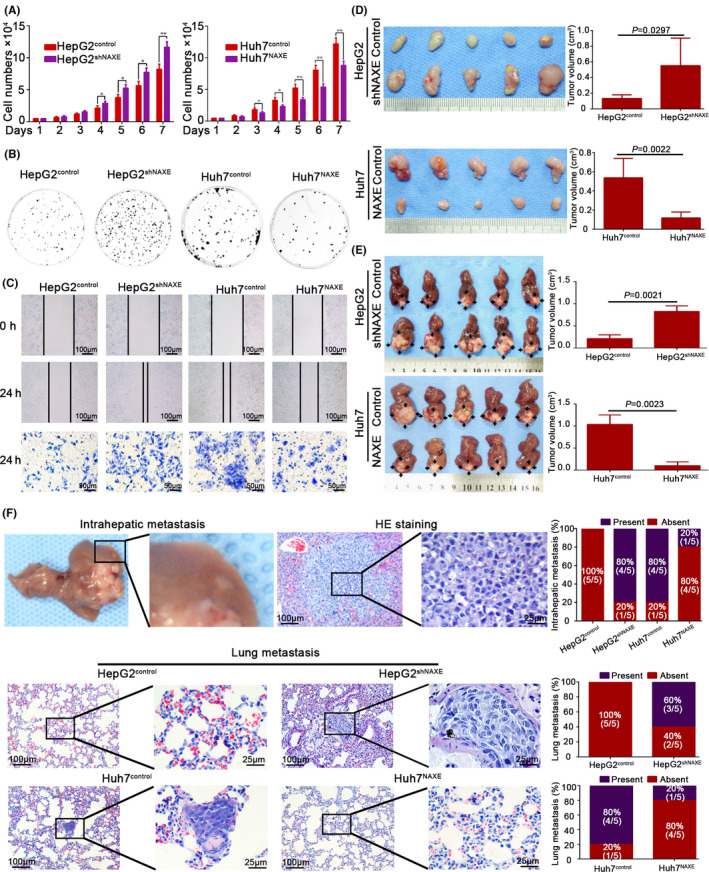
FIGURE 2.

Low NAXE expression promotes proliferation, migration, and invasion of HCC in vitro and in vivo. A and B, Effects of NAXE knockdown and overexpression on cell proliferation rate (A) and colony formation capacity (B). The data are quantified in Figure S3C. *P < .05; **P < .01. C, Wound healing and transwell invasion assays are performed to detect migratory and invasive ability of indicated cells. The data are quantified in Figure S3D,E. D and E, Subcutaneous tumors (D) and orthotopic tumors (E) from HepG2shNAXE, Huh7NAXE, and their control cells are shown in the upper and lower 2 panels respectively. Tumors size is measured 3 times and compared in the right bar graphs with mean ± SD. F, Representative images of mice intrahepatic metastatic nodules and lung tissue sections in each group. Incidence rate (the number of mice with intrahepatic or pulmonary metastasis/total number of mice used in each group, n = 5) of intrahepatic or lung metastasis in each group is shown in the right bar graphs
