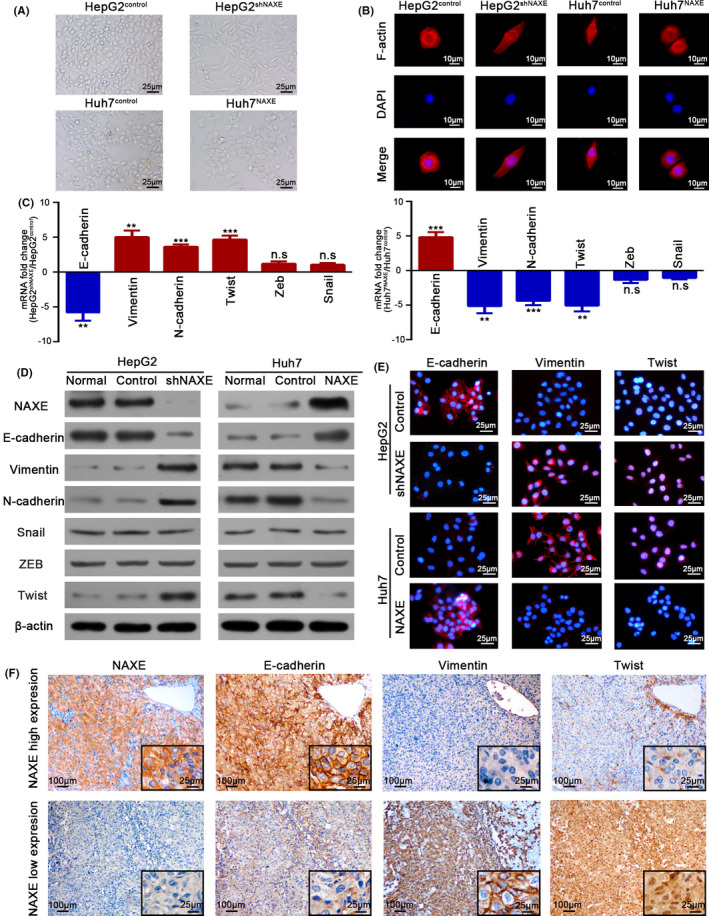
FIGURE 3.

Low NAXE expression promotes EMT in HCC. A, Representative cellular morphology of HepG2shNAXE, Huh7NAXE, and their control cells. B, Cytoskeleton of indicated cells is visualized by staining F‐actin with rhodamine‐phalloidin. DAPI was used to stain nuclei. C, Fold change of mRNA expression for epithelial and mesenchymal markers, as well as EMT‐associated transcription factors is compared in NAXE‐interfered HCC cells. **P < .01; ***P < .001; n.s., no significant difference. D, Protein expression of epithelial and mesenchymal markers, as well as EMT‐associated transcription factors is detected by western blot. E, Representative immunofluorescence images of E‐cadherin, vimentin, and Twist in indicated cells. The nuclei are stained by DAPI. F, Serial sections of HCC tissues with high or low NAXE expression are immunostained to detect E‐cadherin, vimentin and Twist expression. The black frames in the lower right corner show higher magnification of corresponding images
