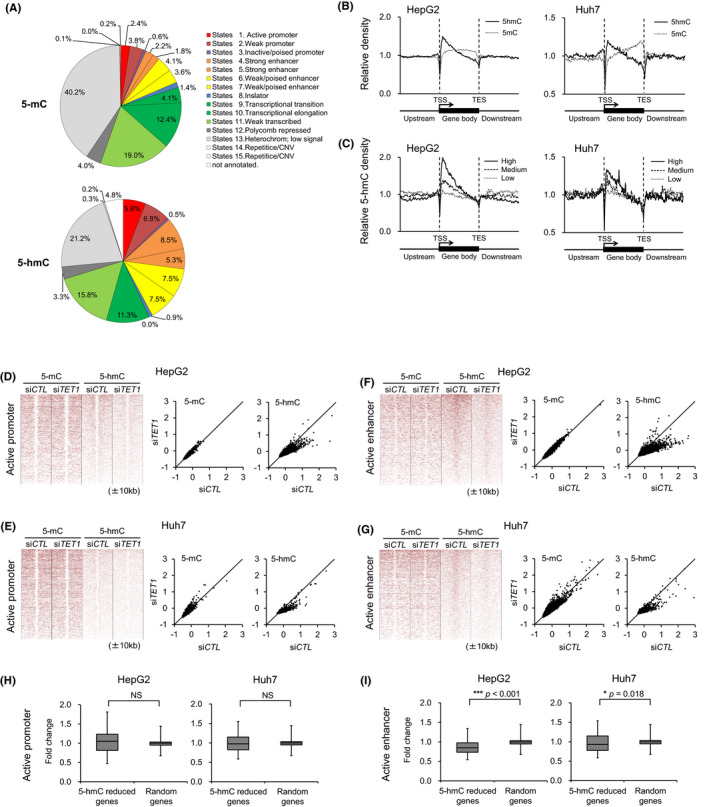
FIGURE 4.

Genome‐wide distributions of 5‐hmC and the effect of TET1‐knockdown at the promoters and enhancers. A, Chromatin status of 5‐mC–enriched regions (upper) and 5‐hmC–enriched regions (lower) in HepG2 and Huh7 cells. B, 5‐hmC and 5‐mC distributions of HepG2 and Huh7 cells relative to human RefSeq gene position, respectively. C, 5‐hmC distributions relative to human RefSeq gene position by hmeDIP‐seq according to the expression levels in HepG2 and Huh7. Expression level: high, GeneChip score >250; low, GeneChip score <25; medium, GeneChip score 25‐250. D‐G, Heat map representation around active promoters and enhancers (±10 kb) with enriched 5‐mC and 5‐hmC in HepG2 (D, F) and Huh7 (E, G) cells with siCTL and siTET1. Active promoters (D, E) are classified by genomic elements (H3K4me3 and H3K27ac positive). Active enhancers (F, G) are classified by genomic elements (H3K4me3 negative, and H3K27ac and H3K4me1 positive). The heat map is rank‐ordered by 5‐hmC levels of siCTL. Z‐values of 5‐mC or 5‐hmC enrichments around active promoters (D, E) and active enhancers (F, G) (±5 kb) in HepG2 and Huh7 cells with siCTL and siTET1 are shown. Z‐value indicates normalized deviations based on a normal distribution. H, Boxplot of the expression changes in HepG2 and Huh7 cells with siCTL and siTET1 by expression microarray (U133 plus 2.0) at the active promoter of 5‐hmC reduced genes (HepG2, 578 probes; Huh7, 517 probes) and randomly selected genes (each 1000 probe). 5‐hmC–reduced genes show the genes whose 5‐hmC sum score of hmeDIP‐seq around active promoter (±200 bp) is reduced to one‐fifth by TET1 knockdown. I, Boxplot of the expression changes in HepG2 and Huh7 cells with siCTL and siTET1 by expression microarray (U133 plus 2.0) at active enhancer of 5‐hmC–reduced genes (HepG2, 94 probes; Huh7, 118 probes) and randomly selected genes (each 1000 probe). 5‐hmC–reduced genes show the genes whose 5‐hmC sum score of hmeDIP‐seq around active enhancer (±200 bp) is reduced to one‐fifth by TET1 knockdown. P‐values were measured using the Mann‐Whitney U‐test in (H) and (I). *P < .05; ***P < .001
