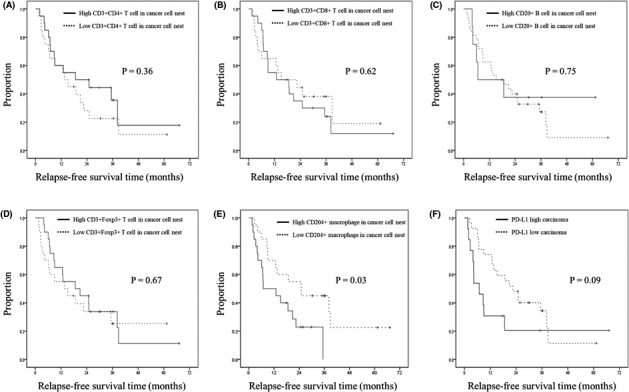
FIGURE 3.

Kaplan‐Meier curve of post–neoadjuvant chemoradiation resections for pancreatic ductal adenocarcinoma (PDAC) patients. Relapse‐free survival time classified by the counts of CD3+/CD4+ T cells (A), CD3+/CD8+ T cells (B), CD20+ B cells (C), CD3+/Foxp3+ T cells (D), CD204+ macrophages (E), and PD‐L1+ carcinoma cells (F)
