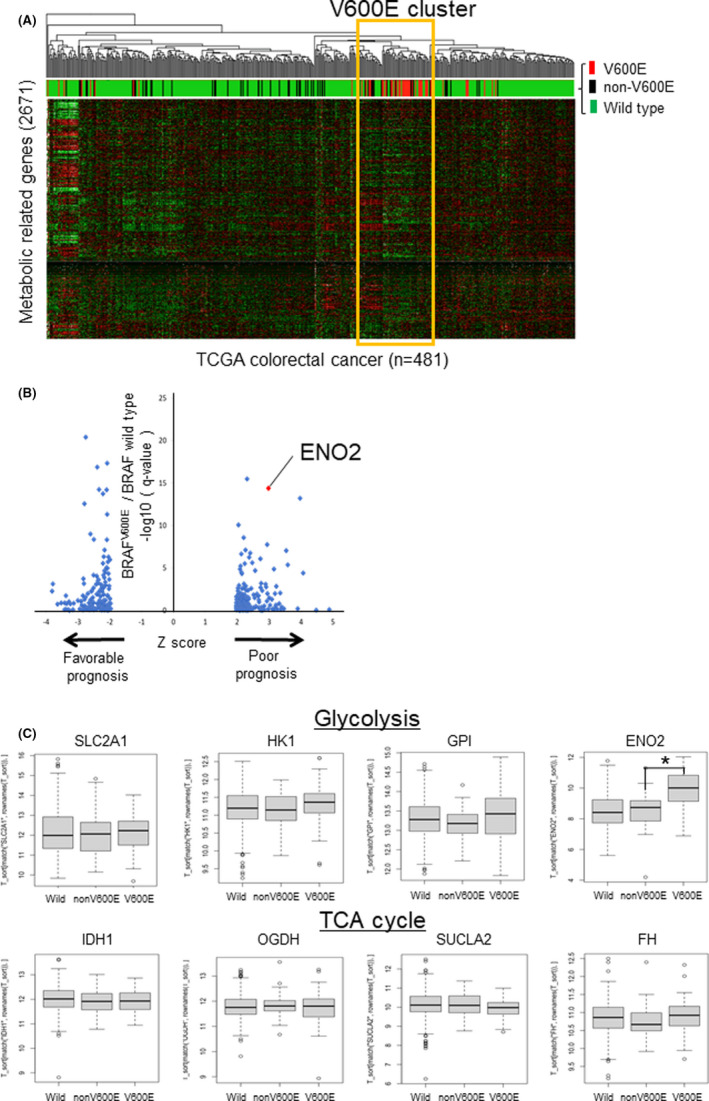
FIGURE 1.

Identification of specific metabolic gene expression signatures of BRAF V600E‐mutated CRC. A, Unsupervised hierarchical clustering using the TCGA COADREAD dataset based on the expression of metabolism‐related genes (n = 2752). The colors of the upper bar represent the BRAF mutation status; red, black, and green represent BRAF V600E‐mutated, non–V600E mutated, and wild‐type tumors, respectively. B, Scatterplot showing the differentially expressed genes between BRAF V600E‐mutated tumors and wild‐type tumors. The horizontal axis indicates the Z‐score, which represents the statistical significance of each gene’s association with patient prognosis. The vertical axis indicates the q‐value (−log 10) and the statistical significance of the comparison between BRAF V600E‐mutated tumors and wild‐type tumors. Only genes with |Z‐score| > 1.96 are shown. C, Expression of representative metabolic‐related genes according to BRAF mutation status. (Upper) Glycolytic enzyme. (Lower) tricarboxylic acid cycle (TCA) enzymes (*P < .0001)
