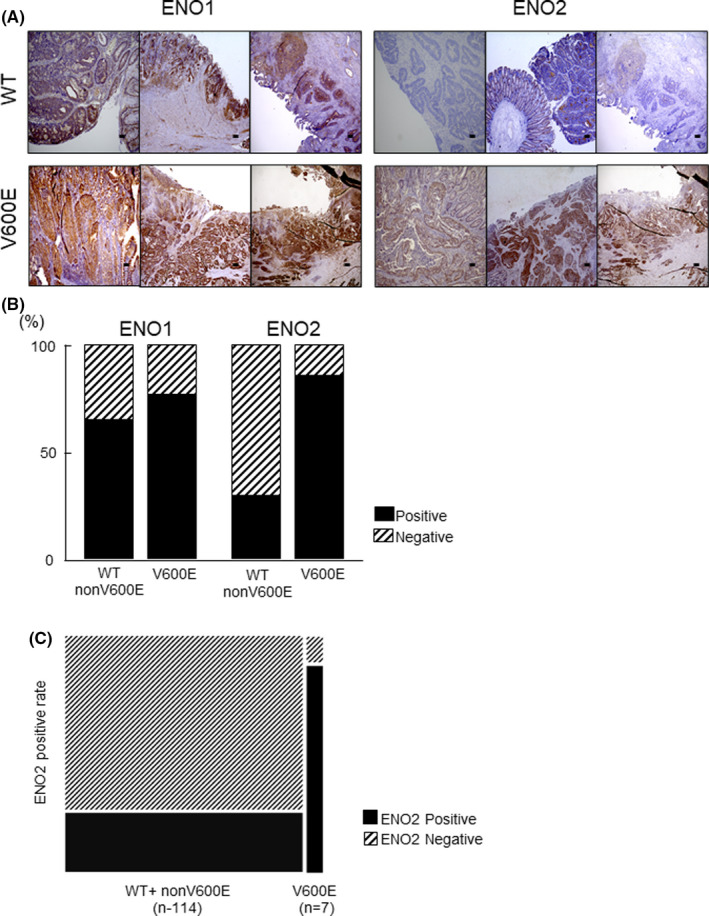
FIGURE 2.

Immunohistochemical analysis of ENO1 and ENO2 in BRAF wild‐type and BRAF V600E‐mutated CRC. A, Representative images of positive and negative immunohistochemical staining with anti–ENO2 antibody in BRAF wild‐type CRC and BRAF V600E‐mutated CRC. Scale bar: 50 µm. B, The positive rate of ENO1 and ENO2 expression in BRAF wild‐type and BRAF V600E‐mutated CRC based on immunohistochemical staining. C, The positive rate of ENO2 expression in BRAF wild‐type+nonV600E and BRAF V600E‐mutated CRC based on immunohistochemical staining in 121 CRC patient
