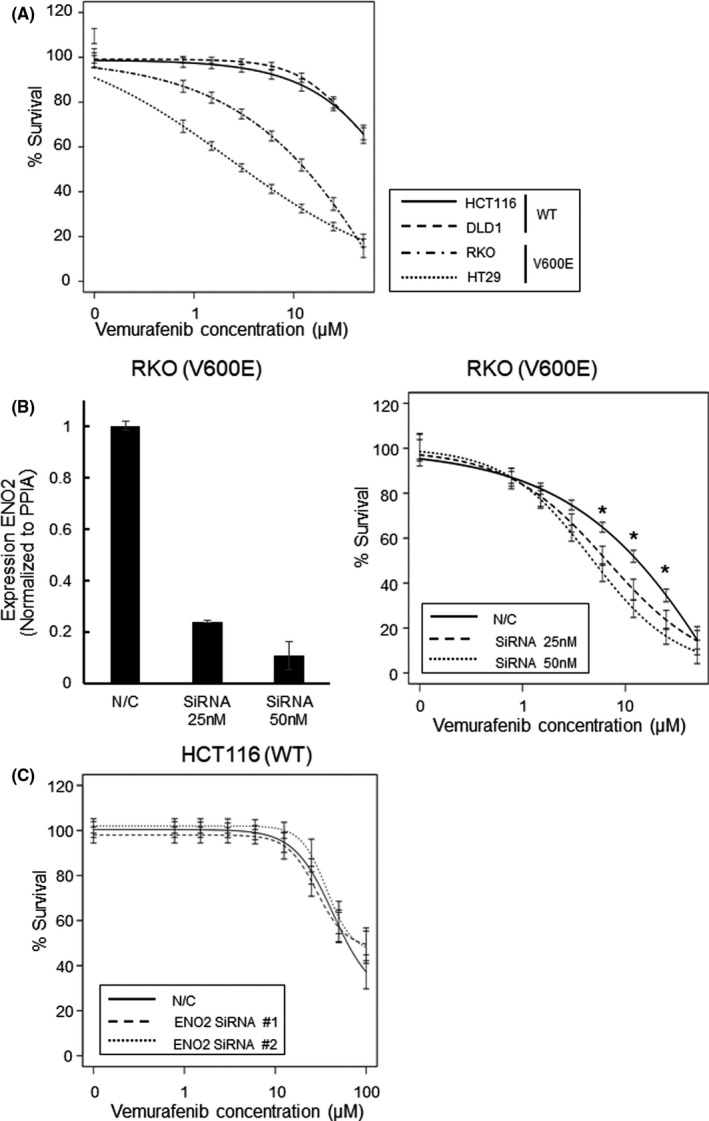
FIGURE 5.

Combinational inhibition of BRAF V600E and ENO2 attenuate proliferation of BRAF V600E‐mutated cells. A, Dose response curve after exposure to vemurafenib in CRC cell lines. B, (Left) mRNA expression levels of ENO2 transfected with N/C or ENO2 SiRNA (25 and 50 nmol/L). (Right) Dose response curve after exposure to vemurafenib in RKO cells transfected with N/C or ENO2 siRNA (25 and 50 nmol/L). (*P < .05). C, Dose response curve after exposure to vemurafenib in HCT116 cells transfected with N/C or ENO2 siRNA. Each bar represents the mean ± SEM of quintuple measurements
