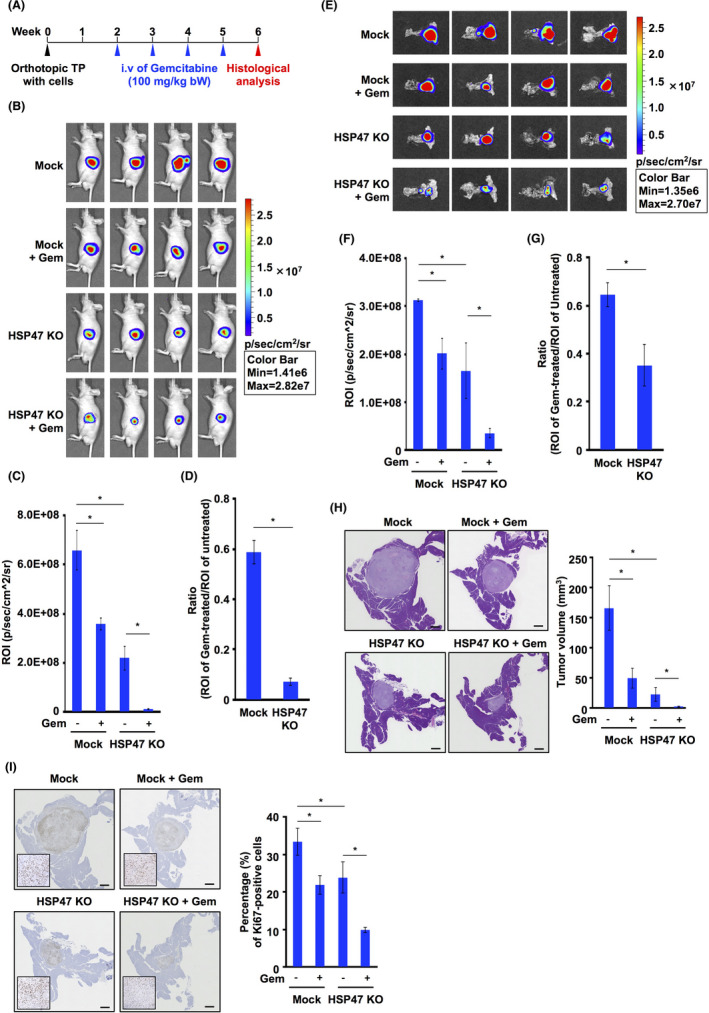
FIGURE 7.

Disruption of HSP47 augments the efficacy of chemotherapy with gemcitabine for pancreatic tumors. A, Scheme of the animal experiment. B, Luminescence of MIA‐PaCa2‐luc cell‐transplanted or HSP47 KO MIA‐PaCa2‐luc cell‐transplanted mice treated with or not treated with gemcitabine. Representative images at 7 d after the final injection of gemcitabine are shown. C, Quantification of luminescence of MIA‐PaCa2‐luc cell‐transplanted or HSP47 KO MIA‐PaCa2‐luc cell‐transplanted mice at 7 d after the final treatment with gemcitabine. D, Effect of gemcitabine treatment on luminescence of MIA‐PaCa2‐luc cell‐transplanted or HSP47 KO MIA‐PaCa2‐luc cell‐transplanted mice at 7 d after the final injection of gemcitabine. E, Luminescence of pancreatic tissues from MIA‐PaCa2‐luc cell‐transplanted or HSP47 KO MIA‐PaCa2‐luc cell‐transplanted mice treated with or not treated with gemcitabine. Representative images of pancreatic tissues at 7 d after the final injection of gemcitabine are shown. F, Quantification of luminescence of pancreatic tissues from MIA‐PaCa2‐luc cell‐transplanted or HSP47 KO MIA‐PaCa2‐luc cell‐transplanted mice at 7 d after the final treatment with gemcitabine. G, Effect of gemcitabine treatment on luminescence of pancreatic tissues from MIA‐PaCa2‐luc cell‐transplanted or HSP47 KO MIA‐PaCa2‐luc cell‐transplanted mice at 7 d after the final injection of gemcitabine. H, Effect of gemcitabine treatment on tumor volumes in MIA‐PaCa2‐luc cell‐transplanted or HSP47 KO MIA‐PaCa2‐luc cell‐transplanted mice. Representative images of pancreatic tissues with HE staining are shown (left panel). Quantification of tumor volume is shown (right panel). (I) Effect of gemcitabine treatment on proliferation index in tumor tissues from MIA‐PaCa2‐luc cell‐transplanted or HSP47 KO MIA‐PaCa2‐luc cell‐transplanted mice. Representative images of Ki67‐positive cells in pancreatic tissues with Ki67 staining are shown (left panel). Quantification of Ki67‐positive cells in tumor tissues is shown (right panel). *, P < .05. Scale bars: 1 mm
