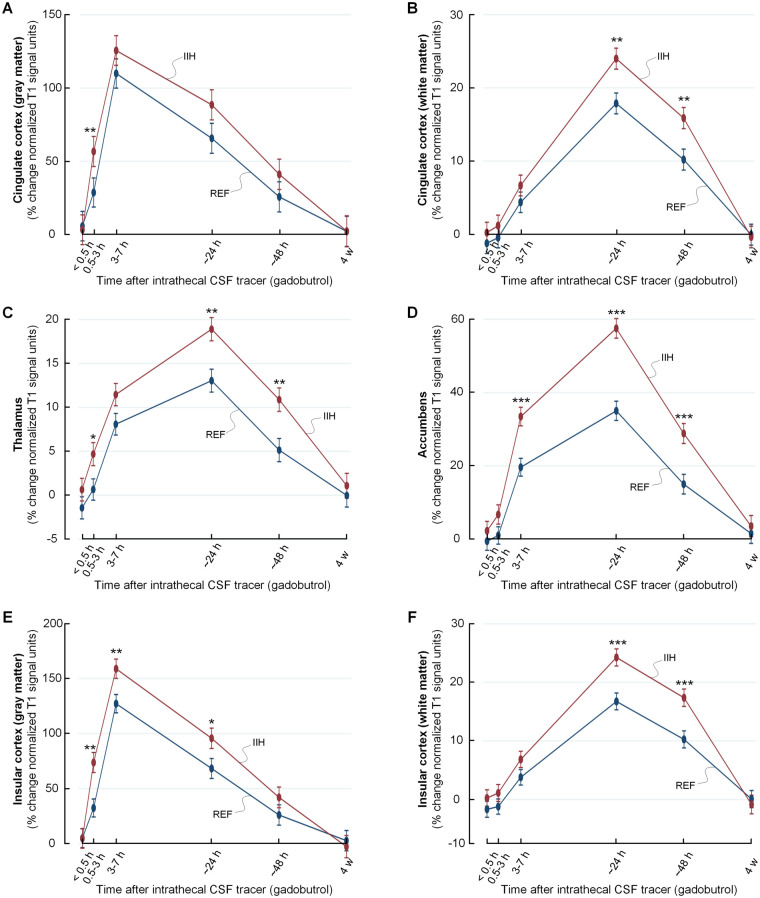
Figure 6.
Increased CSF tracer levels in selected limbic structures of IIH patients indicative of reduced molecular clearance. The trend plots of percentage change in tracer enrichment (normalized signal unit ratio) reveal significantly stronger tracer enrichment in enrichment and clearance phases in IIH as compared to REF groups for several brain regions belonging to the limbic system. The regions included cingulate cortex (grey matter) in A, cingulate subcortex (white matter) in B, thalamus in C, accumbens area in D, insular cortex (grey matter) in E and insular subcortex (white matter) in F. Trend plots are presented with mean ± standard error (SE). Statistical differences: *P < 0.05, **P < 0.01 and ***P < 0.001 (linear mixed models).

