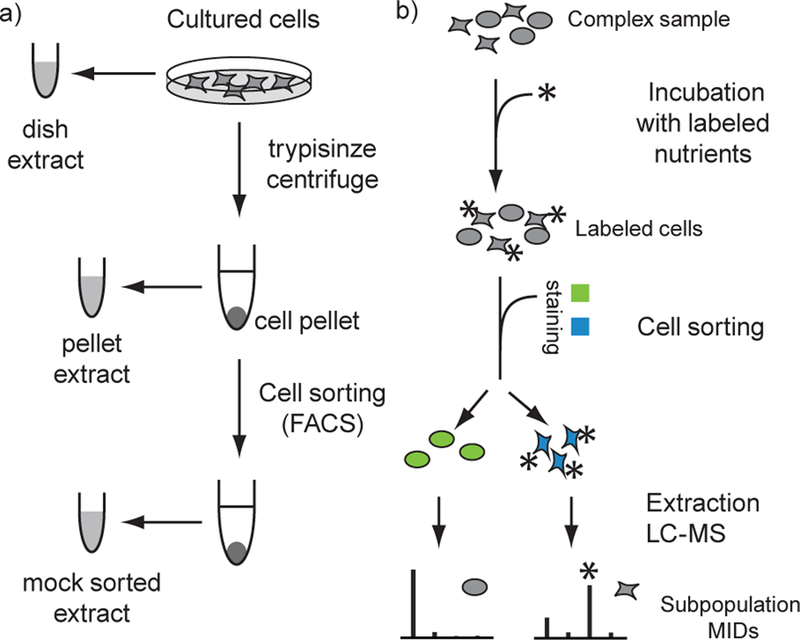
Figure 1.

Schematic diagram of the experimental design. a) Comparison of sorted cells populations based on isotope label content. The complex sample is pulse labelled prior to sorting, and differences between subpopulation are reflected in the MIDs. Subpopulations extracts are analyzed separately by LC-HRMS. b) Design of validation experiment. Metabolomics of mock sorted cells were benchmarked with dish and pellet extracts.
