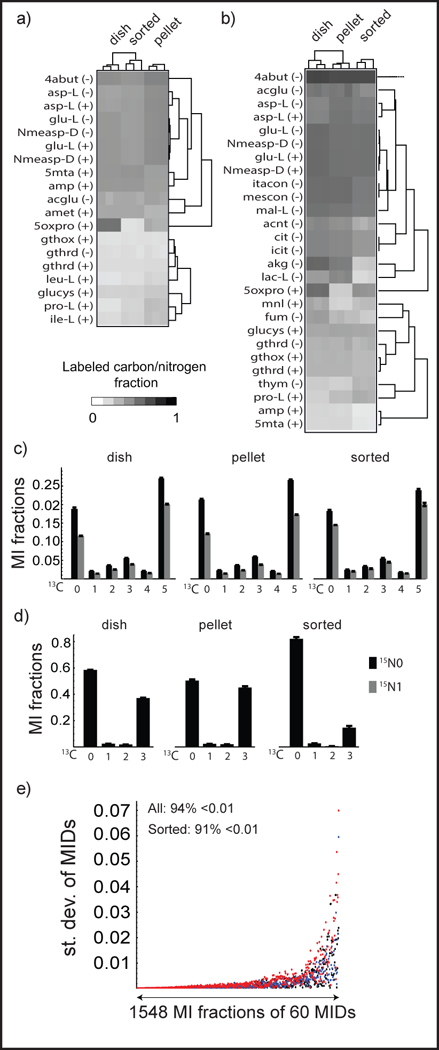
Figure 3.

MID data from the validation experiment. (a and b) Heat map of 15N (a) 13C (b) enrichment clustered by metabolites and samples. Unlabeled metabolites, mainly essential nutrients are not shown. c) 13C-15N MIDs of Glutamate. (d) 13C MIDs of Lactate, The error bars are standard deviations of triplicate measurements in (a) and (b). (e) Standard deviation (st.dev) of MI fractions of 60 MIDs. (−) stands for negative mode, (+) stands for positive mode. Descriptions of metabolites can be found in Table S-1.
