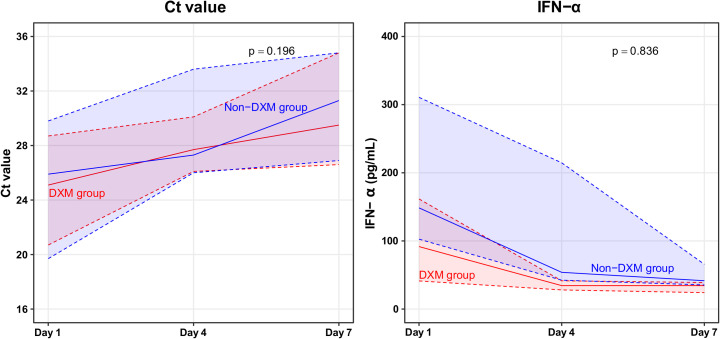
Fig 5. Severe acute respiratory syndrome coronavirus 2 load and type I interferon response during the 7-day study period.
Solid lines represent the median values and the shaded areas bordered by dotted lines represent the upper and lower quartiles. Ct, cycle threshold; DXM, dexamethasone; IFN-α, interferon-α.

