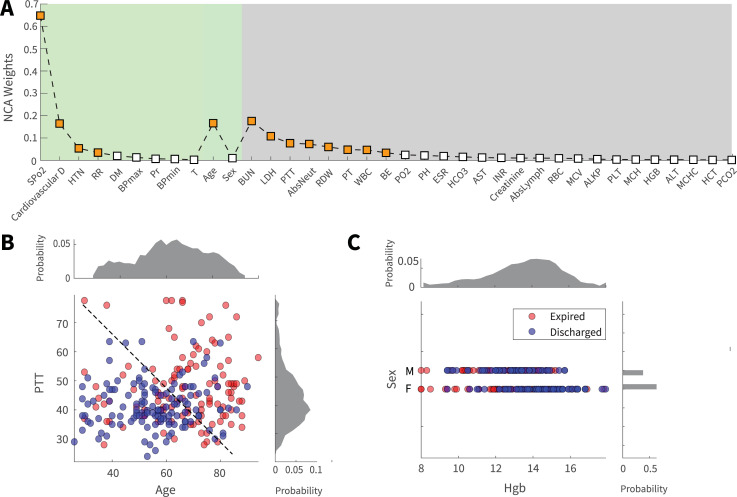
Fig 2. Contribution of demographic, clinical, and laboratory features to mortality prediction.
(A) The results of the regularized NCA analysis displays the contribution of single features to mortality prediction. Features are sorted based on contribution importance and category. Features with prominent weights were displayed by orange squares for visual convenience. (B) is a favorable feature space (PTT and age) where the information content of features with respect to the outcome is high, so many data points could be visually distinguished via an illustrative decision border. Panel (C), in contrast, demonstrates unfavorable feature space where the low information content of features has led to data points becoming crunched and hard to distinguish (Sex and Hgb). Panels B and C were created using half of the data and Principal Component Analysis (PCA) for illustrative purposes.

