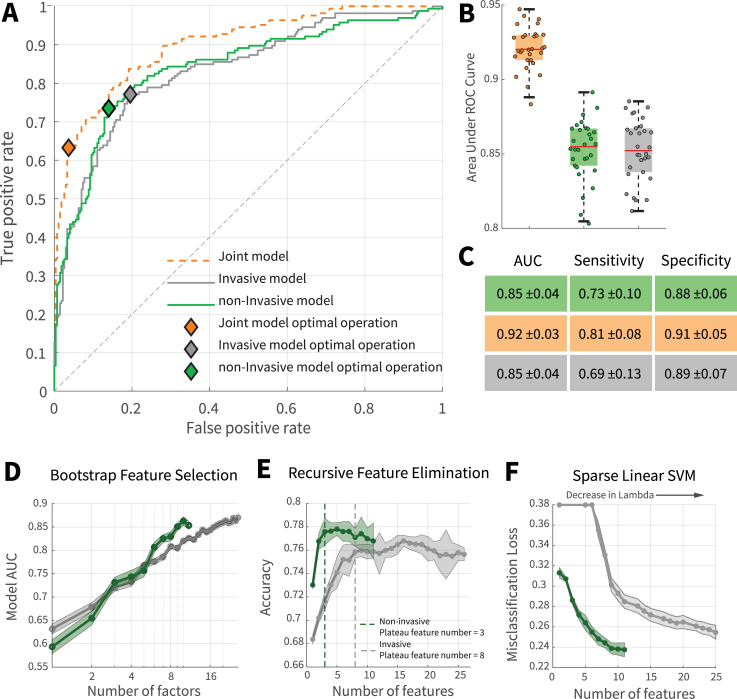
Fig 3. Comparison of mortality prediction of invasive and non-invasive models.
(A) ROC curve of joint, invasive, and non-invasive models. (B) Investigation of models’ performance and robustness towards sample size. For each data point, a model was trained and evaluated using 90% of data which was randomly bootstrapped from the main dataset while maintaining the original discharge to expired ratio. The models were robust to the sample size and no significant difference was observed between the performance of invasive and non-invasive models. (C) Performance table of invasive, non-invasive, and joint models. Performances are reported as mean along with standard deviations. (D) Comparing the dynamics of laboratory and non-invasive features for randomly selected combinations of features. (E) Recursive feature elimination. Compared with invasive features, prominent non-invasive features had significant prediction information contents. In general, the first three features with prominent contributions to the improvement of the non-invasive model’s performance were SPO2, age, and presence of cardiovascular disorders; the first three invasive features were BUN, LDH, and PTT. (F) Sparsity analysis. Sparse linear SVM was utilized to investigate optimal feature combinations for fixed predictor numbers. For a specific sparsity level (features number), the non-invasive model performs better than the invasive model. Green and gray represent non-invasive and invasive modes, respectively.

