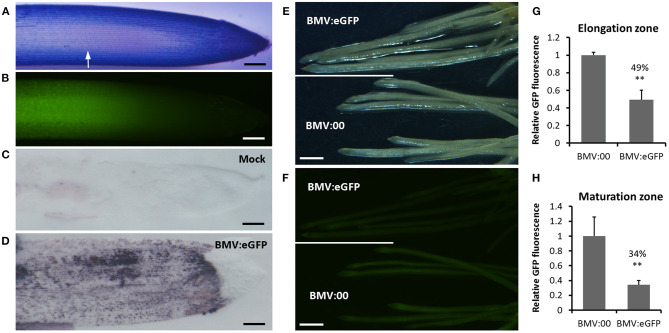
Figure 4.
Silencing transgenically-expressed GFP in wheat roots with BMVCP5. (A) Root apical region from transgenic OsRCg2GFP wheat (cv. fielder) seedlings expressing GFP stained with toluidine blue. White arrow indicates the start of the elongation zone. (B) Green fluorescence from GFP detected in the elongation zone of the same root as in panel (A). Accumulation of BMV in a wheat root from plants inoculated with sap of N. benthamiana leaves without virus (Mock, C), or containing BMV:eGFP (180-nt insert; D), detected by tissue-print assay using a polyclonal antibody against the BMV CP. Purple color indicates presence of virus. Bars in (A–D) = 200 μm. (E) Bright-field image of roots at 21 dpi from plants infected with BMV:eGFP or BMV:00 (no insert control). (F) Fluorescence from roots in panel E showing silencing of GFP in transgenic OsRCg2GFP wheat roots after infection with BMV:eGFP, but not BMV:00. Images taken with an Olympus SZX 12 fluorescence microscope. Bars (E,F) = 1 mm. Similar results were obtained in three independent experiments. Quantification of GFP fluorescence in the elongation zone (G) and maturation zone (H) of roots at 21 dpi from plants infected with BMV:00 or BMV:eGFP. Values represent means + SD of six to eight biological replicates, and treatment values compared (t-test; **P < 0.01). Percentage values are relative to the BMV:00 treatment.

