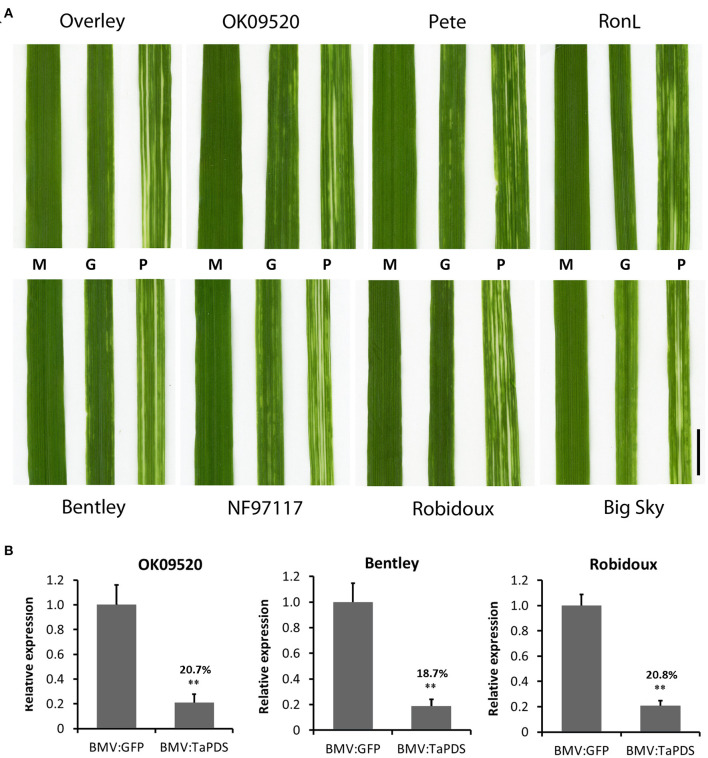
Figure 7.
BMVCP5-induced TaPDS silencing in eight winter wheat cultivars. (A) Images show a representative phenotype of the 3rd systemic leaf at 22 dpi from plants infected with mock (M), BMV:eGFP107 (G) or BMV:TaPDS100 (P). Bar = 1 cm. (B) TaPDS mRNA expression levels in the 3rd systemic leaf at 22 dpi from plants infected with BMV:eGFP (107-nt insert) or BMV:TaPDS (100–nt insert) in cultivars OK09520, Bentley and Robidoux, analyzed by RT-qPCR with values across treatments normalized against the transcript level of TaEF1α. Expression percentages are given relative to the BMV:eGFP control. Values represent means + SD of five biological replicates, and treatments compared (t-test; **P < 0.01). Similar results were obtained in two independent experiments.

