. 2021 Jul 2;10:e66493. doi: 10.7554/eLife.66493

Figure 4. PABPC depletion causes premature decay of shorter-tail cytoplasmic mRNAs in HeLa cells.

(A) The effect of PABPC knockdown on poly(A)-tail length. The plots compare median poly(A)-tail lengths in either PABPC1-knockdown cells (left) or PABPC1 and PABPC4 double-knockdown cells (right) to those in control cells. Results are shown for cytoplasmic mRNAs with ≥100 poly(A) tags (gray) and for mitochondrial mRNAs (red), merging data for MT-ATP6 and MT-ATP8 and for MT-ND4 and MT-ND4L, which are bicistronic mitochondrial mRNAs. (B) The effect of PABPC knockdown on the abundance of mRNAs with different tail lengths. Shown are tail-length distributions of all cytoplasmic (left) and mitochondrial (right) mRNA poly(A) tags in control, PABPC1-knockdown, and double-knockdown cells. For each distribution, the abundance of tags was normalized to that of the spike-in tail-length standards. Due to depletion of tail-length calling at position 50, which was associated with a change in laser intensity at the next sequencing cycle, the values at this tail length were replaced with the average of values at tail lengths 49 and 51 nt. (C) The effect of PABPC knockdown on the abundance of mRNAs with different tail lengths, comparing tail-lengths measured by sequencing (left) with those observed on RNase H northern blots (right). Results are shown for a cytoplasmic mRNA GAPDH (top) and a mitochondrial mRNA MT-CYB (bottom). Relative tag density was calculated by log-transforming linear tag density using normalized poly(A) tag counts. Median tail-length values are indicated (horizontal lines) and listed in parentheses. For RNase H northern blots, a DNA oligonucleotide complimentary to the 3′-UTR was used to direct cleavage of the target mRNA by RNase H, leaving a 35-nt fragment of the 3′-UTR appended to the poly(A) tail, which was resolved on a denaturing gel and detected by a radiolabeled probe. Tail lengths indicated along the left side of each gel are inferred from lengths of size markers. (D) The effect of PABPC knockdown on the abundance of mRNAs with different tail lengths, extending the intragenic analysis to tail-length distributions from thousands of genes. Heat maps compare poly(A)-tag levels in PABPC1-knockdown (left) or double-knockdown (right) cells to those in control cells, after normalizing to spike-in tail-length standards, as measured using tail-length sequencing. Each row represents mRNAs from a different gene, and rows are sorted based on fold change of mRNA abundance measured using RNA-seq. Only genes with ≥100 poly(A) tags in each of two samples being compared were included in the analyses (n = 5504). Columns represent values from 5-nt tail-length bins ranging from 0 to 244 nt and a 6-nt bin ranging from 245 to 250 nt. Tile color indicates the fold change of normalized tag counts (key). (E) The effect of PABPC knockdown on the abundance of mRNAs with different tail lengths, reanalyzing data from (D) to show distributions of poly(A)-tag changes observed at different tail-lengths. Each box-whisker shows the 10th, 25th, 50th, 75th, and 90th percentile of fold changes in normalized poly(A)-tag counts observed for each tail-length bin of (D). The color of each box indicates the median value (key). Tail-length measurements in this figure were obtained using TAIL-seq.

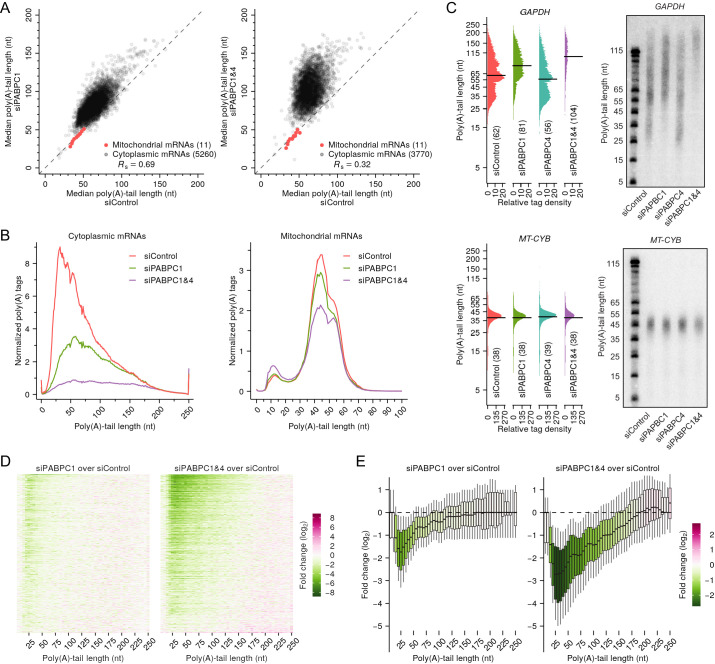
Figure 4.

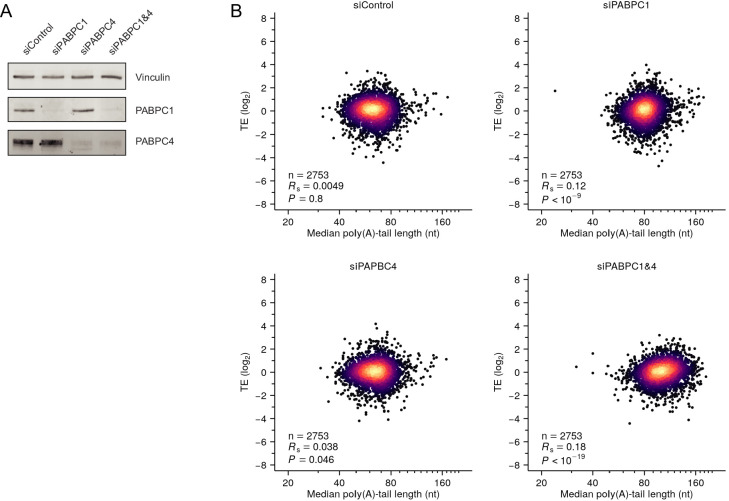
Figure 4—figure supplement 1. PABPC depletion is not sufficient to establish strong coupling between poly(A)-tail length and TE in HeLa cells.

Figure 4—figure supplement 1.

(A) Western blot showing siRNA-mediated depletion of PABPC1 and PABPC4 in HeLa cells. (B) The effect of depleting PABPC on coupling between tail length and TE in HeLa cells. Shown is the relationship between TE and median poly(A)-tail length after transfecting HeLa cells with the indicated siRNAs. A point representing the mRNA from one gene (SPECC1) fell outside the plot area in the PABPC1 and PABPC4 double-knockdown sample. Otherwise, this panel is as in Figure 2A. Tail-length measurements were obtained using TAIL-seq.
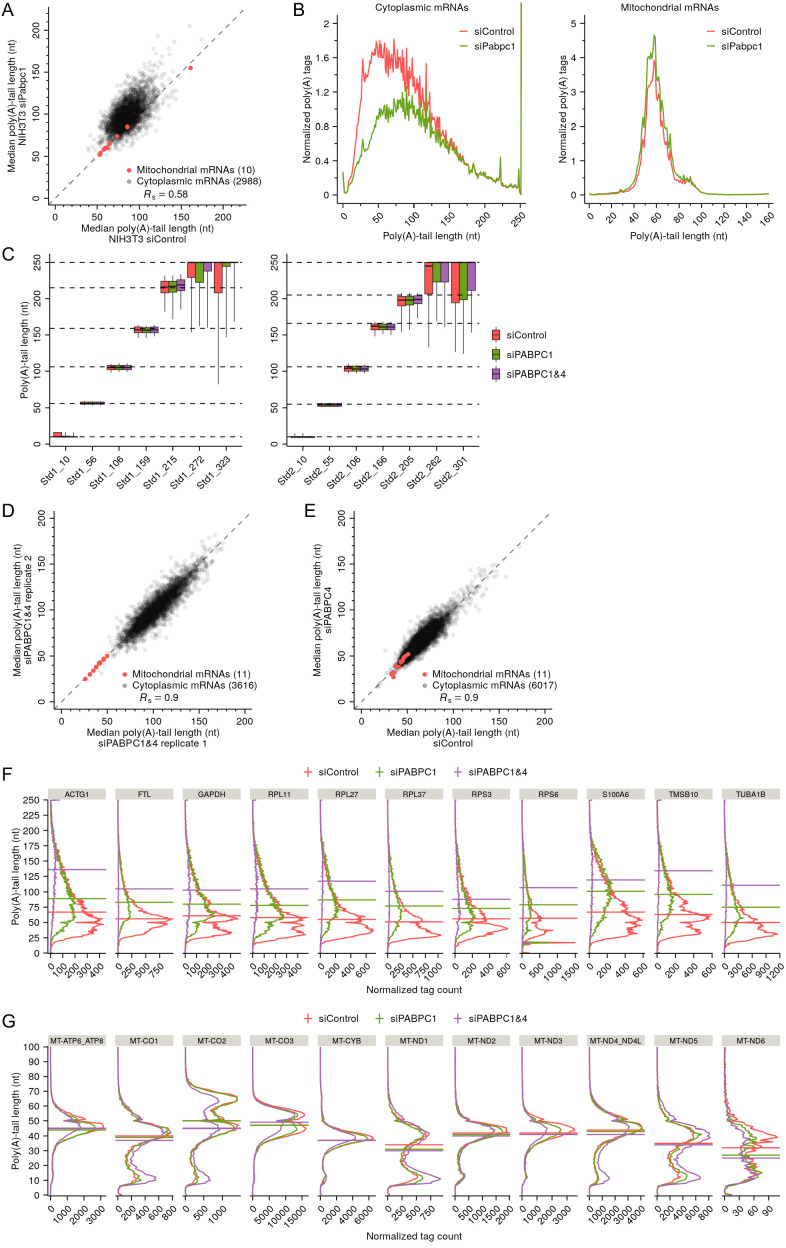
Figure 4—figure supplement 2. Support and extension of experiments showing that PABPC depletion causes premature decay of short-tailed mRNAs in HeLa cells.

Figure 4—figure supplement 2.

(A) The effect of PABPC knockdown on poly(A)-tail length in NIH3T3 cells. The plot compares median poly(A)-tail length in PABPC1-knockdown cells to that in control cells. Results are shown for mRNAs with ≥100 poly(A) tags (gray) and for mitochondrial mRNAs (red), merging data for Mt-atp6 and Mt-atp8 and for Mt-nd4 and Mt-nd4l, which are bicistronic mitochondrial mRNAs, and excluding data for Mt-nd6, which does not have a poly(A) tail. (B) The effect of PABPC knockdown on the abundance of mRNAs with different tail lengths in NIH3T3 cells. Shown are tail-length distributions of all cytoplasmic (left) and mitochondrial (right) mRNA poly(A) tags in control and PABPC1-knockdown cells. For each distribution, the abundance of tags was normalized to that of the spike-in tail-length standards. (C) The quality of the tail-length measurements, as determined using internal tail-length standards. Boxplots summarizing poly(A) tail-length distributions of two sets of tail-length standards spiked into total RNA samples obtained from HeLa cells transfected with the indicated siRNAs. Each box-whisker shows the 10th, 25th, 50th, 75th, and 90th percentile of poly(A)-tail lengths. The dashed horizontal lines represent median tail lengths of individual standards, as determined by mobility in denaturing gels (Subtelny et al., 2014). (D) Reproducibility of tail-length measurements. The plot compares median poly(A)-tail lengths from two replicates of the double-knockdown HeLa cells, merging data for MT-ATP6 and MT-ATP8 and for MT-ND4 and MT-ND4L, which are bicistronic mitochondrial mRNAs. (E) The effect of PABPC4 knockdown on poly(A)-tail length in HeLa cells. The plot compares median poly(A)-tail length in PABPC4-knockdown cells to that in control cells. Results are shown for mRNAs with ≥100 poly(A) tags (gray) and for mitochondrial mRNAs (red), merging data for MT-ATP6 and MT-ATP8 and for MT-ND4 and MT-ND4L, which are bicistronic mitochondrial mRNAs. (F) The effect of PABPC knockdown on the tail-length distributions of top-expressed cytoplasmic mRNAs in HeLa cells. Plotted for mRNAs from each of the indicated genes are tail-length distributions in control, PABPC1- and double-knockdown cells, indicating median values with horizontal lines. For each distribution, the abundance of tags was normalized to that of the spike-in tail-length standards. (G) The effect of PABPC knockdown on the tail-length distributions of mitochondrial mRNAs in HeLa cells. Data were merged for MT-ATP6 and MT-ATP8 and for MT-ND4 and MT-ND4L, which are bicistronic mitochondrial mRNAs. Otherwise, this panel is as in (F). In this figure, tail-length measurements were obtained using PAL-seq v3 (A–B) and TAIL-seq (C–G).
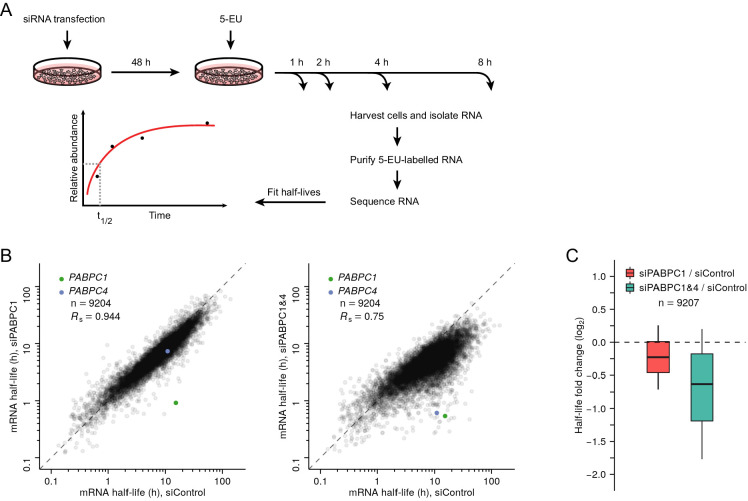
Figure 4—figure supplement 3. Measurements of mRNA half-lives in PABPC-depleted HeLa cells.

Figure 4—figure supplement 3.

(A) Experimental scheme for measuring mRNA half-lives in HeLa cells. siRNA-transfected cells were incubated with 5-ethynyl uridine (5-EU), and cytoplasmic mRNA was harvested at the indicated time points. 5-EU-labeled RNA was biotinylated, isolated, and sequenced, using spike-in standards to normalize results from different time points. For labeled mRNA isolated from each gene, the approach to equilibrium was then fit to obtain its half-life. (B) The effect of PABPC knockdown on cytoplasmic mRNA half-lives in HeLa cells. For each gene, the mRNA half-life in PABPC1-knockdown cells (left) or in double-knockdown cells (right) is compared to that in control cells. Points representing mRNAs from three genes RHOB, TSC22D3, PLEKHO2 fell outside the plot areas. (C) Distribution of the effects of PABPC knockdown on mRNA stability. Boxplots summarize the fold differences of mRNA half-lives observed in (B) (including three genes that fell outside the plot areas) when comparing PABPC1-knockdown or double-knockdown cells with control cells. Each box-whisker shows the 10th, 25th, 50th, 75th, and 90th percentile.
Figure 4—figure supplement 3—source data 1. Source data for mRNA half-life values shown in Figure 4—figure supplement 3B–C.