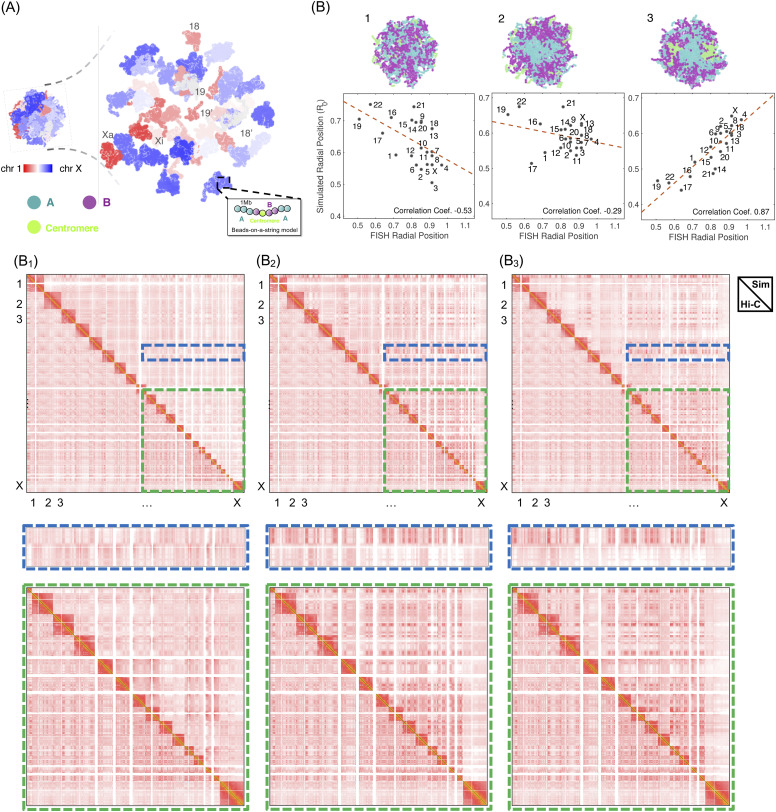
FIG. 4.
Data-driven mechanistic modeling of the whole-genome organization. (a) An example configuration of the diploid human genome colored from red to white and to blue with increasing chromosome ID. Each chromosome is modeled as a string of beads that can either be A (cyan) compartments, B (purple) compartments, or centromeres (green). (b) Example genome configurations colored by bead types (top), comparison between simulated and experimental chromosome radial positions (bottom), and comparison between simulated (upper triangle) and experimental (lower triangle) genome-wide contact maps for three genome models. In model 1, only one set of parameters was used to model intra- and inter-chromosomal interactions, while two sets of independent parameters were used in model 2. In model 3, in addition to the use of independent parameters for intra- and inter-chromosomal interactions, the centromeric regions were explicitly represented with a new type.

