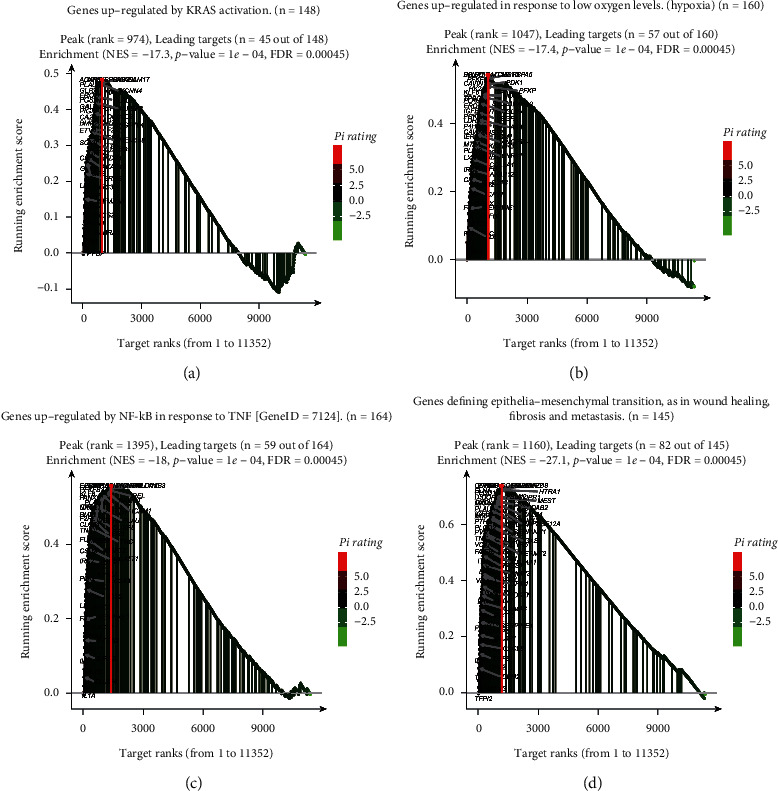
Figure 13.

GSEA analysis for high- and low-risk groups. (a) Mainly enriched in KRAS activation. The genes marked in black are the dominant genes. (b) Mainly enriched in genes upregulated in response to low oxygen levels (hypoxia). The genes marked in black are the dominant genes. (c) Mainly enriched in the genes regulated by NF-kB in response to TNF. The genes marked in black are the dominant genes. (d) Mainly enriched in the genes defining epithelial–mesenchymal transition, as in wound healing, fibrosis, and metastasis. The genes marked in black are the dominant genes.
