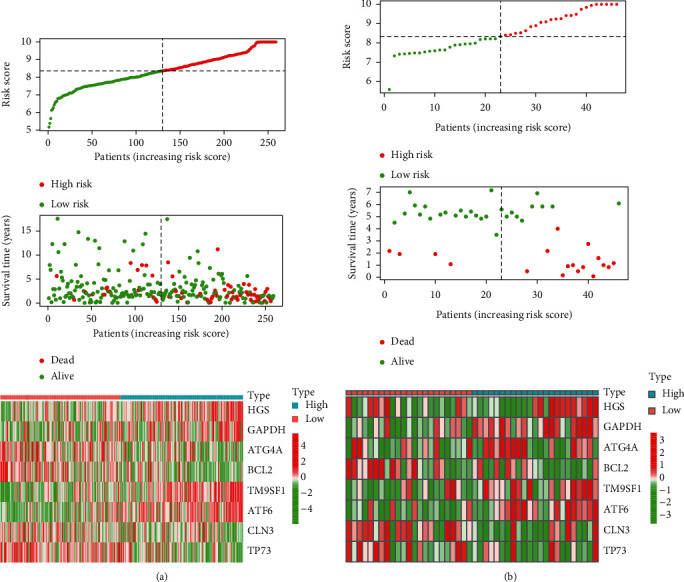
Figure 6.

Construction and validation of risk signatures of eight autophagy prognostic genes. The relationship between risk score (top), risk scores and survival time (middle), risk score and gene expression in training set TCGA (a) and validation set GSE52903 (b). The black dotted line represents the median of the risk score.
