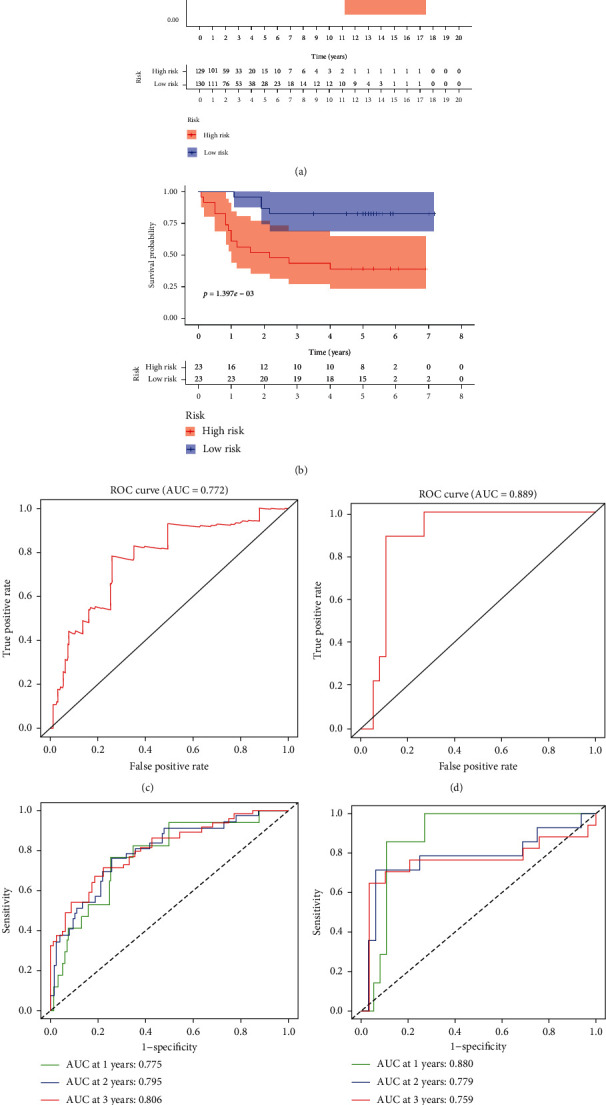
Figure 7.

Kaplan–Meier survival analysis and ROC curve analysis risk model. Kaplan–Meier survival curves of the high- and low-risk groups were found in TCGA (a) and GSE52903 (b). ROC curve analysis of TCGA (c) and GSE52903 (d). The ROC curve analysis was used to predict 1, 3, and 5 years in TCGA (e) and GSE52903 (f).
