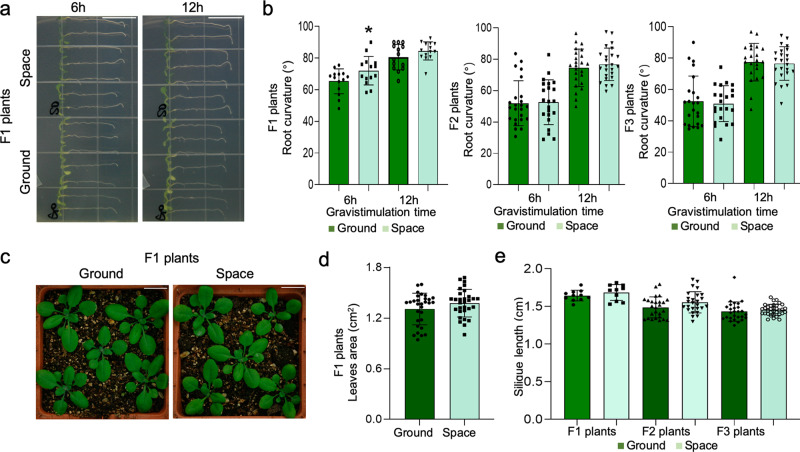
Fig. 3. Comparison of the gravitropic orientation analysis, leaf area, and silique length phenotypes in the offspring of spaceflight and the ground control plants.
a, b The 90o change in gravitropic orientation analysis of the offspring seedlings of the spaceflight and ground control samples. The experiment was conducted in the F1 generation and the F2/F3 generations of Arabidopsis seedlings at 8-d-old and 7-d-old, respectively. The data shown are the average values of 14 samples in the F1 generation (n = 14) and 24 samples in the F2/F3 generation (n = 24). c, d The rosette leaf area of the offspring of spaceflight and ground control samples. Leaf area was determined by using ImageJ software. The data shown are the mean ± standard deviation values obtained for eight leaves (n > 30). e The silique length analysis in the offspring of spaceflight and ground samples. The data shown are the mean ± standard deviation values (n > 10). An asterisk * indicates a statistically significant difference between the samples by using Student’s two-tailed t-test (p < 0.05). Scale bar indicates 1 cm.

