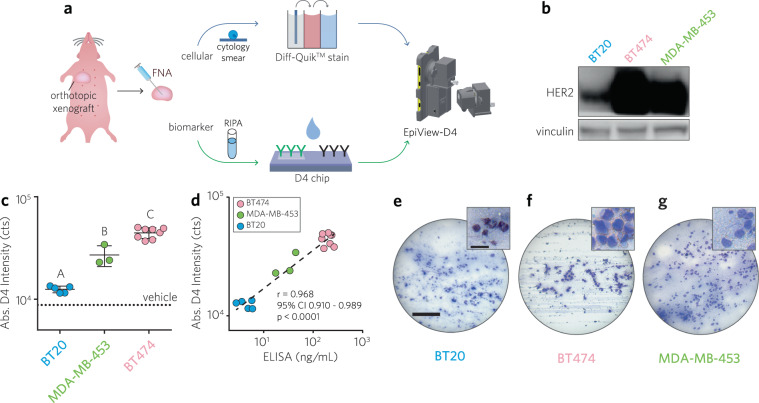
Fig. 4. Evaluation of solid tumor xenografts from nude mice orthotopically engrafted with human breast cancer cell lines with EpiView-D4.
a Schematic of workflow. Tumor aspirates are divided into two aliquots; one aliquot from an aspirate is processed as a cytology specimen on a glass slide using a Diff-QuikTM rapid staining kit and then imaged using the brightfield imaging attachment (top row), The second aliquot is lysed in RIPA buffer and applied to a D4 chip and its HER2 level is quantified using the fluorescence attachment on the EpiView-D4. b Representative western blots against HER2 for each human breast cancer cell line used for xenografting (BT20, BT474, and MDA-MB-453). Vinculin used as loading control. c Results of HER2 credentialing for 16 different solid tumor specimens from BT20, BT474, and MDA-MB-453 xenografts (N = 5, 8, 3, respectively). Each data point represents the D4 fluorescence intensity (average of duplicates) measured by the EpiView-D4 for individual mouse tumors, categorized by xenograft line. Also shown is the mean ± 95% CI fluorescence intensity for each category, which mirrors the western blots shown in panel b. There was a statistically significant difference between groups as determined by one-way ANOVA (F (2, 13) = 76.10, p < 0.0001). Multiple comparison testing showed significant differences between each group (Tukey post hoc test, p ≤ 0.05). d D4 fluorescence intensity by EpiView-D4 for each mouse tumor from f plotted against corresponding HER2 ELISA. Pearson r = 0.968, p < 0.0001, 95% CI: 0.910–0.989). e–g Representative LPF (main panel) and HPF (inset) images of FNA preparations for each xenograft line confirm malignant cytology (see Supplementary Fig. 4 for representative images with standard microscope). Scale bars for LPF and HPF images are 0.2 mm and 30 µm, respectively.

