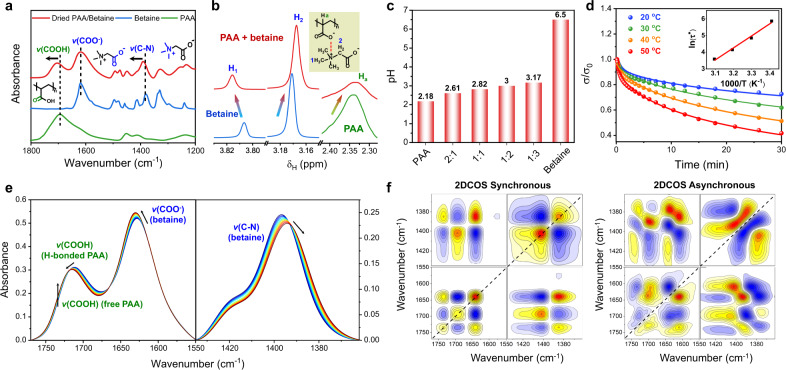
Fig. 2. Internal interactions of PAA/betaine elastomer.
a FTIR spectra and assignments of PAA, betaine, and dried PAA/betaine. b 1H NMR spectra of PAA, betaine, and PAA/betaine in D2O. The total solute concentrations are all 0.1 M. c pH values of 0.1 M PAA/betaine solutions with different AA:betaine molar ratios. d Iso-strain–stress relaxation curves at different temperatures. The inset is the corresponding fitted result according to Arrhenius equation. e Temperature-variable FTIR spectra of PAA/betaine elastomer upon heating from 20 to 70 °C in the regions of v(C = O) and v(C–N) (interval: 5 °C). f 2DCOS synchronous and asynchronous spectra generated from (e). In 2DCOS spectra, the warm colors (red and yellow) represent positive intensities, while cold colors (blue) represent negative intensities.

