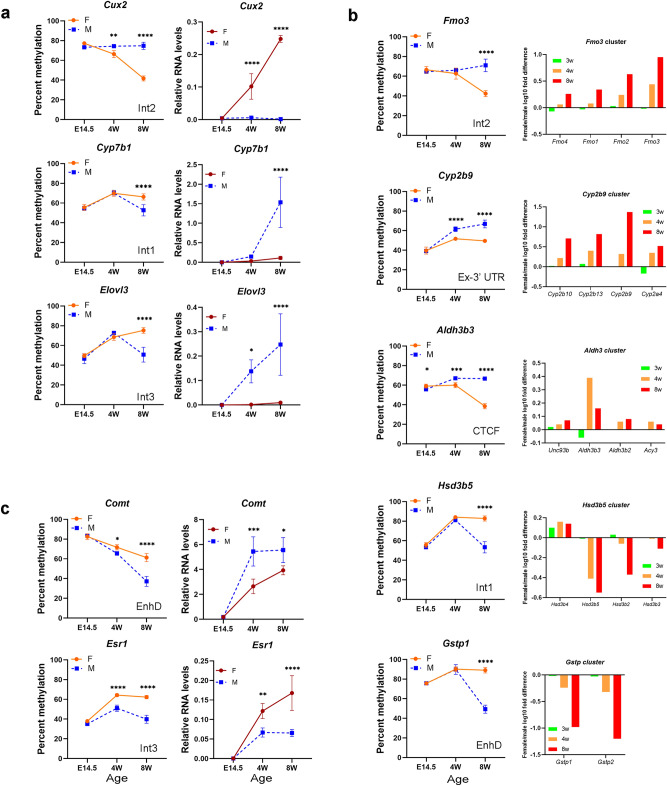
Figure 1.
DNA methylation of sDMRs and proximal sDEGs expression during development. (a) Methylation levels of sDMRs and expression levels of proximal sDEGs for sDMRs associated with a single sDEG (4–6 females and 4–6 males at E14.5, 7 females and 4 males at 4 weeks, and 4 females and 6 males at 8 weeks of age); (b) Left panel, methylation levels of sDMRs with several proximal sDEGs. Right panel, log10 fold difference in gene expression between females and males from dataset GSE347829. (c) Methylation levels of sDMRs and expression levels of proximal genes that did not reach the threshold for sDEG. Location of the sDMR with respect to genomic features is noted as: Int—intron; Ex—exon, EnhD—distal enhancer; CTCF—CTCF-bound region. Error bars show standard deviation. Statistically significant differences between sexes are shown with asterisks *P < 0.05, **P < 0.01, ***P < 0.001; ****P < 0.0001 (two-way ANOVA followed by multiple testing with Sidak’s correction).

