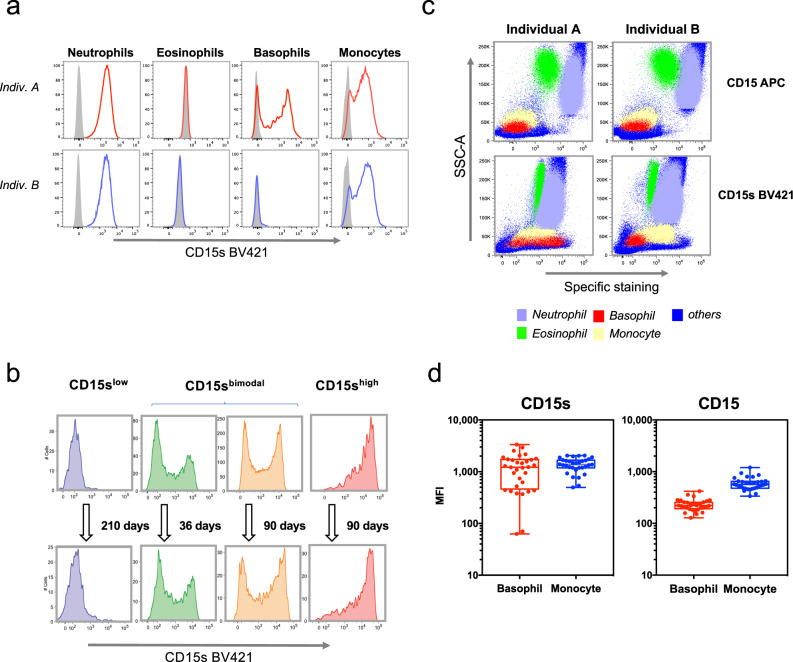
Fig. 1. CD15s (sLex) expression on human basophils.
a CD15s staining. FACS analysis of whole-blood samples of two individuals differing in the CD15s expression on their basophils. CD15s staining is shown for neutrophils, eosinophils, basophils, and monocytes. Gray peaks represent the background staining based on “fluorescence minus one” (FMO). b Temporal stability of the CD15s pattern. The CD15s staining on basophils is shown for four individuals with either low (CD15slow), bimodal (CD15sbimodal), or high CD15s expression on basophils (CD15shigh). Two examples of bimodal expression are shown differing in the ratio between the CD15slow and the CD15shigh peak. The FACS plots indicate CD15s measurement from four different individuals between two time points. c Comparison of CD15 and CD15s expression on various leukocytes. The dot plots represent FACS profile of whole-blood samples of two individuals stained with anti-CD15 and anti-CD15s. The specific staining is shown in reference to the side scatter (SSC-A); the location of neutrophils (violet), eosinophils (green), basophils (red), monocyte (yellow), and other cells (blue) is indicated. Cell populations were defined by cell type-specific gating (Supplementary Fig. 4). d Cohort-wide distribution of CD15s and CD15 expression. The boxplots indicate the mean fluorescence intensity (MFI) of CD15s (n = 32) and CD15 (n = 29) on basophils and monocytes. Each dot represents one individual; all samples were obtained from healthy volunteers of the Singapore SSIC cohort.

