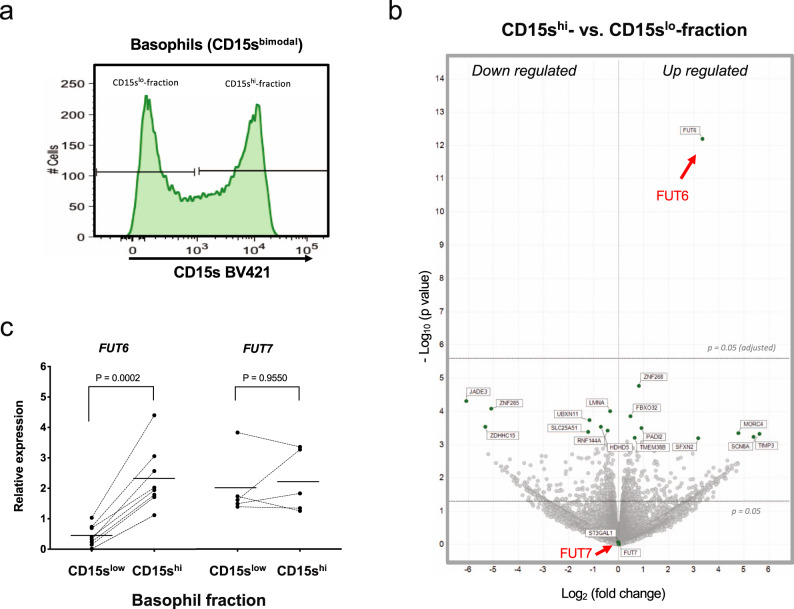
Fig. 3. Gene expression analysis of CD15shigh and CD15slow basophils.
a FACS sorting of CD15shigh and CD15slow fraction of CD15sbimodal individuals. FACS profile and sorting gates of the CD15slow and CD15shigh basophil fraction are shown for one representative donor from six donors. b Volcano plot. The plot summarized the edgeR paired RNA-seq results of the pairs of CD15shigh vs. CD15slow fractions obtained from six CD15sbimodal donors. Each dot represents a gene and the plot displays the fold change (log2) vs. nominal p value (−log10). Boundaries for nominal and adjusted p value are indicated. c Validation by qPCR. The mRNA expression of FUT6 (n = 8) and FUT7 (n = 6) in the CD15slow and CD15shigh fraction validated by qPCR. Paired samples are connected by lines; p values are indicated. Statistical comparison was performed using Wilcoxon matched-pairs signed-rank test.

