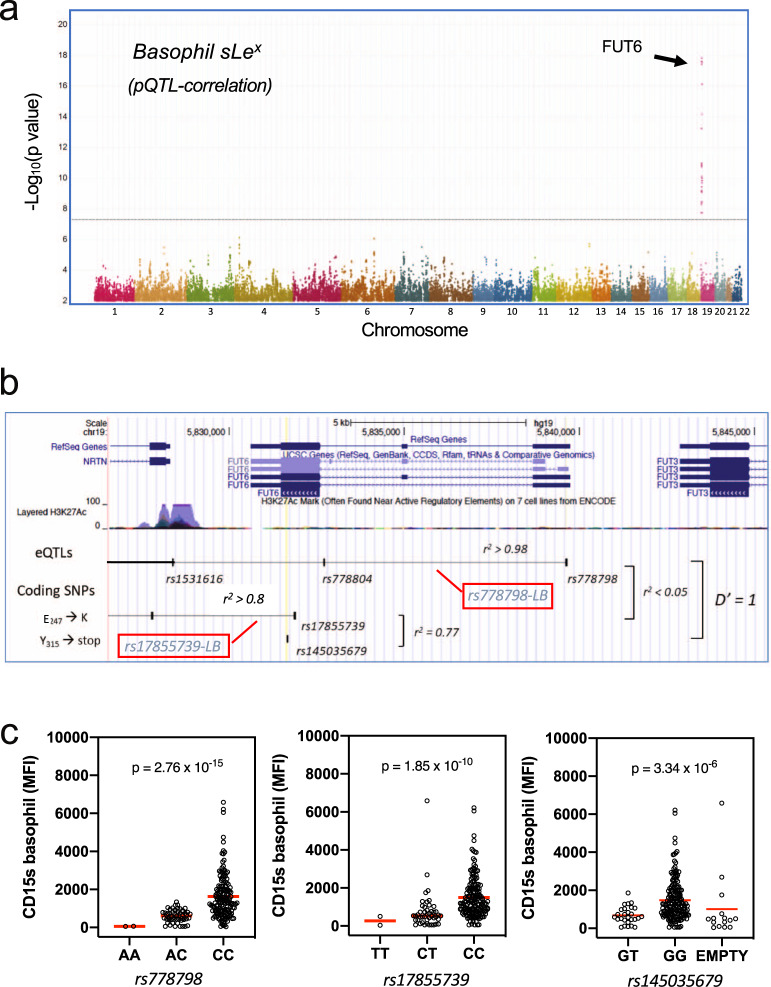
Fig. 4. Genetic control of sLex expression on basophils.
a Genome-wide pQTL correlation. PBMC samples of genotyped individuals (n = 229) were analyzed by FACS. The Manhattan plot summarizes the association of the CD15s MFI of the basophils with the genotypes of the 2 million SNPs covered by this analysis. The x-axis represents the location of SNPs on the 22 autosomal chromosomes, the Y-axis the nominal p values (−log10) of their association with CD15s. A clear association was observed for SNPs on chromosome 19, which are all located proximal to the FUT6 gene. b FUT6 gene locus. The upper part of the figure displays the location of intron and exon elements of FUT6 and neighboring genes together with the density of H3K27Ac marks. The lower part indicates the location of some of the top SNPs identified in the Manhattan plot. They are arranged into two independent linkage blocks rs778798-LB and rs17855739-LB (r2 < 0.05, D’ = 1). rs778804-LB comprises only of non-coding SNPs (rs778798, rs778804, rs1531616, rs1678852, rs199921063, and rs3763045) while rs17855739-LB has also two coding SNPs (rs17855739 and rs145035679). Closely linked SNPs are connected by a horizontal line; the genetic linkage is indicated (r2 and D’); complete list of SNPs is displayed in Supplementary Data 1. c Genotype/phenotype association. The dot plots show the association of the CD15s MFI on basophils with the genotypes of rs778798 AA (n = 2), AC (n = 53), CC (n = 164), and the two coding SNPs rs17855739 (E247→K) TT (n = 2), CT (n = 45), CC (n = 173), and rs145035679 (Y315→stop) GT (n = 27), GG (n = 183), EMPTY (n = 15). Each dot represents one individual, p values are indicated. Plots were generated with the data collected for individuals of Chinese ethnicity from the SSIC cohort21,22. Significance was determined by Kruskal–Wallis tests.

