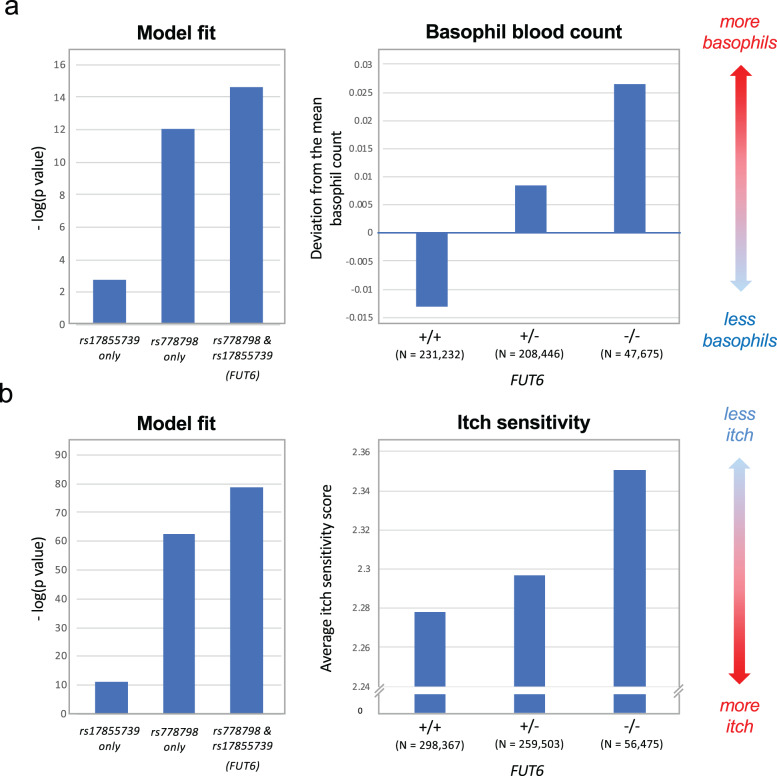
Fig. 7. GWAS data on the association of FUT6 null alleles to blood basophil counts and itch sensitivity.
a Basophil counts. The bar chart on the left shows the negative log10 p value of the association of the basophil blood count with rs17855739, rs778798, and the FUT6 status imputed from these two SNPs (Fig. 4 and Supplementary Fig. 8). The bar chart on the right shows the genotype/phenotype correlation of the FUT6 status (+/+, +/−, −/−) on the basophil blood count of 487,409 individuals of European ancestry, expressed as deviation from the mean basophil count. The data were generated by an extension of the study by Astle et al.24. b Mosquito bite-induced itch sensitivity. The bar chart on the left shows the negative log10 p value of the association of the itch sensitivity with rs17855739, rs778798, and the FUT6 status defined by both SNPs (Supplementary Fig. 8). The box plot on the right shows the genotype/phenotype correlation of the implied FUT6 status (+/+, +/−, −/−) on the average itch sensitivity score of 619,703 individuals of mostly European ancestry. The itch sensitivity score was defined by a questionnaire (0: maximum itch, 5: no itch). The data were provided by 23andMe and an extension of the study by Jones et al.25.

