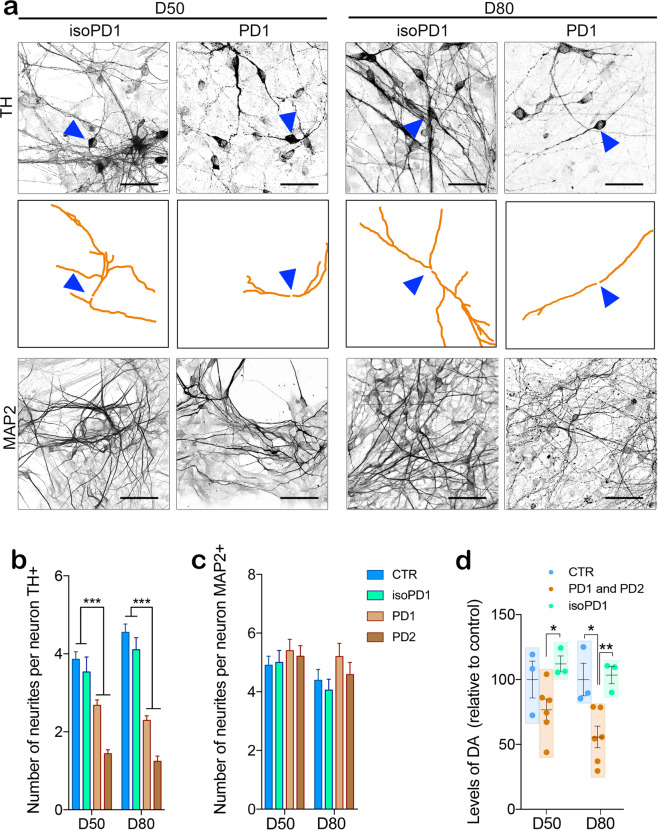
Fig. 6. Biological confirmation of the in silico hypothesis.
a Gene-edited isoPD1 (SP12 wt/wt) and PD1 (SP12) TH+ neuronal processes are traced (orange) to determine the number and the structure of neurites at D50 (left panels) and D80 (right panels). The top panels for each cell line show the original image of TH+ neurons. A blue triangle highlights a representative traced neuron shown in the middle panels. The bottom panels for each cell line show MAP2+ neuronal processes. Scale bar is 50 μm in all images. b The quantification of the number of TH neurites shows significant differences between CTR and PD1 both at D50 and D80. c No differences are detected on the number of MAP2 neurites. d Levels of released DA measured in culture media from CTR (SP11), PD1 (SP12), PD2 (SP13), and isoPD1 (SP12 wt/wt) at D50 and D80 of differentiation, relative to CTR levels. *p-value < 0.05; **p-value < 0.01; ***p-value < 0.001 (ANOVA with multiple comparison analysis). Number of independent experiments n = 3.

