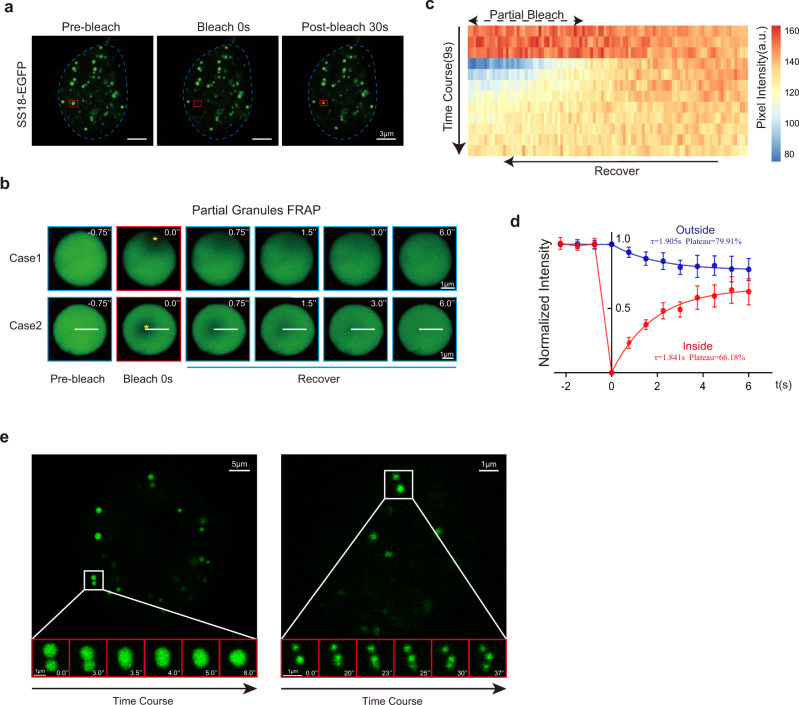
Fig. 3. SS18 forms condensates.
a Representative images of FRAP experiments with lentiviral SS18-EGFP expressed in mESCs. The droplet undergone bleaching was indicated in the red box. The blue dotted line represents the nuclear boundary. Scale bars,3 μm. laser intensity 2.5%, detector gain 500 V, background subtraction treatment. Seven condensates from two independent experiments. b Time course microscopy images of fluorescence recovery in SS18-EGFP condensates after partial photobleaching at the edge (case 1) and middle (case 2). SS18-EGFP was expressed by transient transfection in 293 cells to obtain the large enough condensates. The bleached regions were marked by yellow asterisks. Scale bars, 1 μm. laser intensity 2.5%, detector gain 500 V, background subtraction treatment. Eight condensates from two independent experiments. c Kymography for the time course of pixel intensity along the white line in the condensate of case 2 in (b). The intensity recovered in the bleached region inside the condensate as the unbleached part decreased. Pixel number = 103. d The intensity dynamics inside and outside of the bleached regions within condensates (n = 8) was fit to an exponential function. t = 0 was the bleached time point. τ(inside) = 1.841 s, τ(outside) = 1.905 s; Plateau(inside) = 66.18%, Plateau(outside) = 79.91%, diffusion coefficient on the order of D ~ L2/τ ~5 μm2/s, L is the diameter of the bleached region. Data are mean ± s.d., two-sided, unpaired t test; n = 8 condensates. e Representative droplet fusion events are shown by time course images. SS18-EGFP was expressed by transient transfection to obtain the large condensates as in (b). Scale bars, 2 μm. laser intensity 2.5%, detector gain 500 V, background subtraction treatment. Nine fusion/fission cases.

