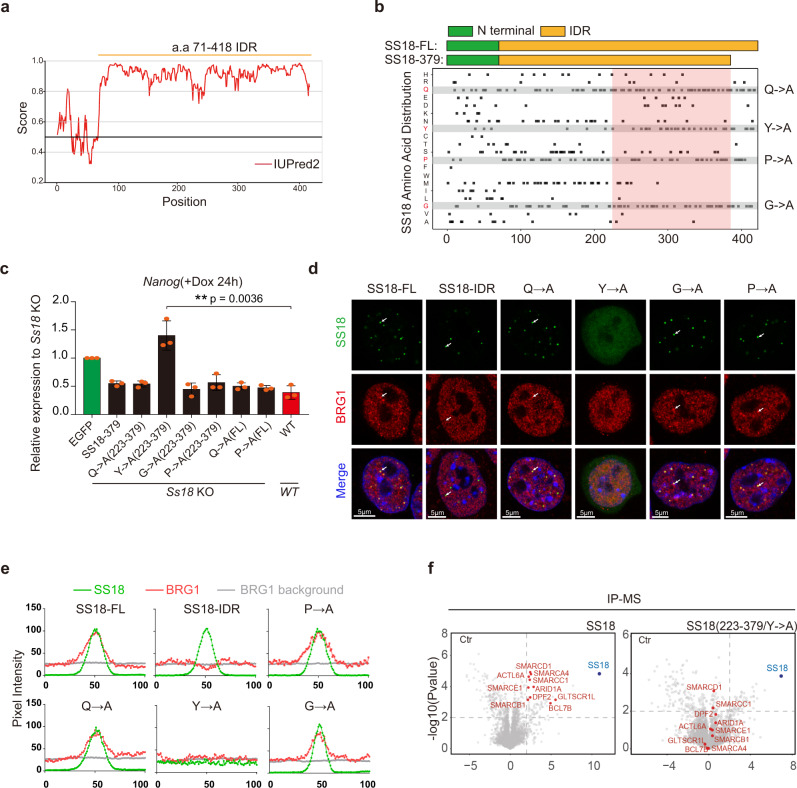
Fig. 4. SS18 condensates through a tyrosine-based mechanism.
a Graph plotting intrinsic disorder of SS18 by the IUPred2A algorithm (https://iupred2a.elte.hu/). IUPred2 scores are shown on the y axis, and the amino acid positions are shown on the x axis. b Schematic illustration for Ss18 truncations shown in the upper panel with the amino acid distribution of SS18 indicated in the lower panel. The pink box highlights the necessary region of C-terminal for the function of SS18 in PST. Q->A, Y->A, P->A, G->A indicate the amino acid Glutamine, Tyrosine, Proline, Glycine mutated to Alanine, respectively. c The expression of Nanog in Ss18−/− mESCs overexpressing the indicated Ss18 mutants during c-Jun based PST. Note the failure of Y-A to rescue PST. Data are mean ± s.d., two-sided, unpaired t test; n = 3 independent experiments, **p < 0.01. d Representative images for the indicated WT, IDR and SS18-mutant-EGFP fusion proteins and immunofluorescence imaging for BRG1 in mESCs. Scale bars, 5 μm. Note the failure of Y-A mutant to form condensates. SS18-EGFP, laser intensity 2.5%, detector gain 500 V. BRG1 immunofluorescence, laser intensity 3.5%, detector gain 750 V. Both SS18-EGFP and BRG1 immunofluorescence were processed by background subtraction. Eight condensates. e The graphs showing the pixel intensity in Fig. 4d. The green curves indicate the pixel intensity dynamic across six condensates of various SS18 mutants and the corresponding pixel intensity of BRG1 indicated by the red curves; the average pixel intensity of BRG1 within nuclei and outside of the nucleoli were indicated by gray curves. f Volcano plots of IP-MS results for FLAG tagged SS18 and SS18Y-A mutant expressed in SS18−/− mESCs by anti-Flag antibody with label-free quantification. SS18−/− cells serves as control. Every point represents a single protein. SS18 and BAF components are marked blue and red. IP-MS experiments were performed in triplicates and a two-sample t test was applied. P = 0.01 and fold change = 2 are used as threshold.

