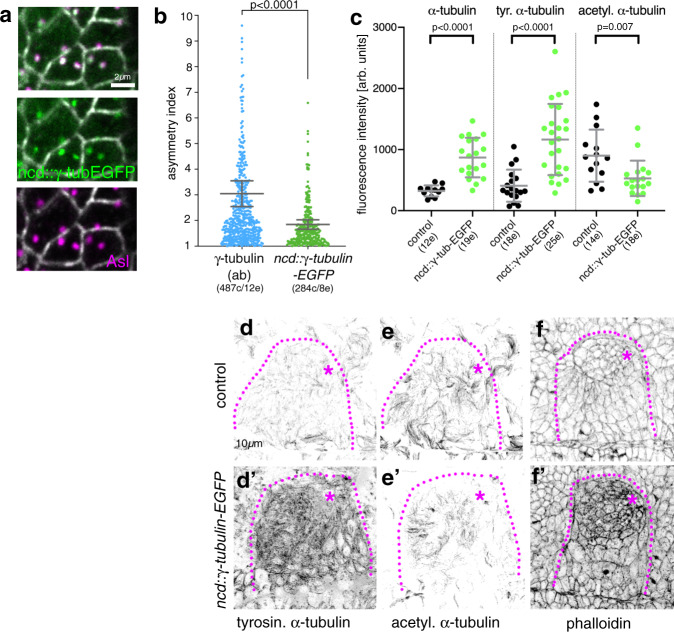
Fig. 3. γ-tubulin overexpression increases microtubule and actomyosin levels.
a, b Overexpression of γ-tubulin using ncd::γ-tubulin-EGFP leads to reduction of γ-tubulin asymmetry at centrosomes (localisation in a–a″ and quantification in b). b ncd::γ-tubulin-EGFP asymmetry was quantified as part of the data illustrated in Fig. 2c, c′. The γ-tubulin (ab) data are reproduced here in comparison to the ncd::γ-tubulin-EGFP overexpression: with n = 284 cells from 8 embryos; statistical significance was deduced by two-sided Mann–Whitney test of comparison as p < 0.0001, shown are mean and 95% CI. c Overexpression of ncd::γ-tubulin-EGFP and loss of γ-tubulin asymmetry leads to increased levels of microtubule labelling using antibodies against α-tubulin or tyrosinated α-tubulin, but a slight reduction in acetylated α-tubulin labelling. Analysed were: 12 embryos for control and 19 embryos for ncd::γ-tubulin-EGFP for α-tubulin, 18 embryos for control and 25 embryos for ncd::γ-tubulin-EGFP fortyrosinated α-tubulin; 14 embryos for control and 18 embryos for ncd::γ-tubulin-EGFP for acetylated α-tubulin. Statistical significance was determined by two-sided unpaired t-tests with Welch’s correction for α-tubulin (p < 0.0001) and tyrosinated α-tubulin (p < 0.0001) and a two-sided Mann–Whitney test for acetylated α-tubulin (p = 0.007), shown are mean ± SD. d–f′ Labelling of stage 11 placodes of control and γ-tubulin overexpressing embryos, showing the increase in tyrosinated α-tubulin (d, d′) and phalloidin labelling to reveal F-actin (f, f′) and the decrease in acetylated α-tubulin labelling (e, e′). See also Supplementary Fig. 4.

