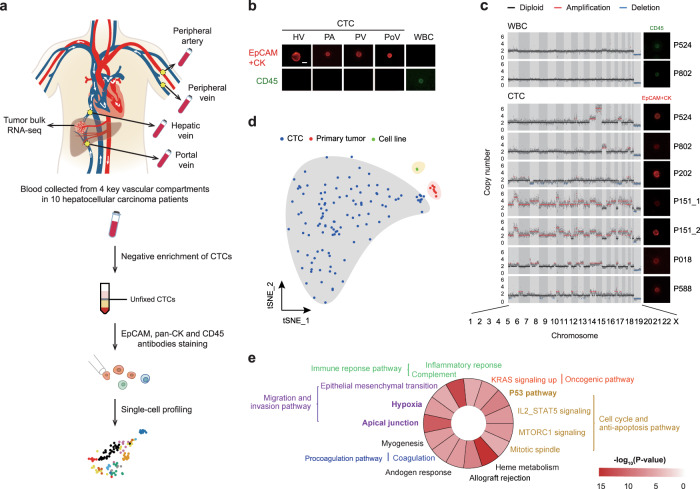
Fig. 1. Characterizing differential gene expression among CTCs, primary tumor, and HCC cell lines based on RNA-seq.
a Overview of the workflow for CTC isolation and single-cell RNA preparation. b Representative fluorescence images of CTCs and WBCs labeled with CD45, EpCAM, and CK antibodies; the scale bar is 10 μm. c CNV profiling of seven EpCAM+ and/or pan-CK+ and CD45− CTCs and two CD45+ WBC from six patients. The fluorescence images of sequenced CTCs and WBCs are displayed. d t-SNE plot illustrates the similarity of the expression profiles between CTCs, primary tumors, and HCC cell lines. e Pathway enrichment in the Hallmark dataset for upregulated genes in CTCs compared with primary tumors. Hypergeometric test was used to test whether DEGs were overlapped with the gene sets. The Benjamini–Hochberg FDR-controlling method for multiple hypothesis testing were performed.

