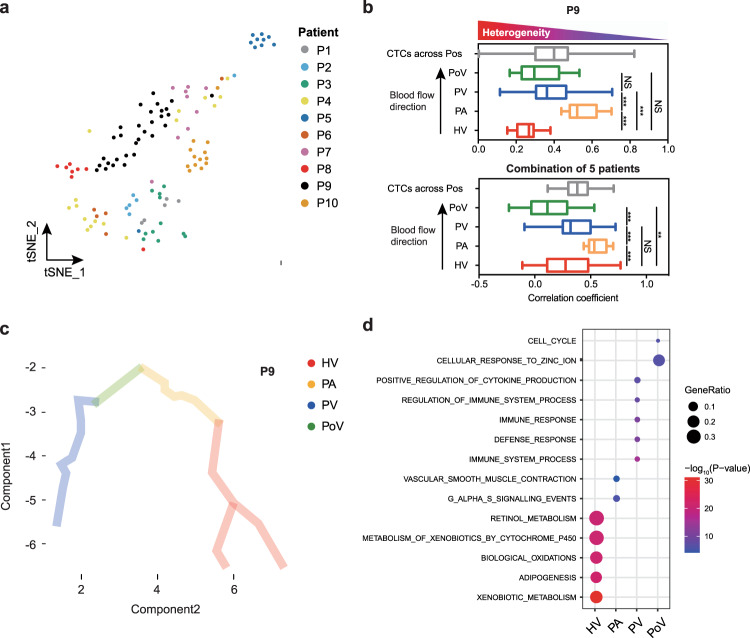
Fig. 2. Spatial transcriptional heterogeneity in CTCs.
a t-SNE plot of CTCs from ten patients reveals their interpatient heterogeneity. b Pearson correlation analysis showing cell-to-cell variability for CTCs drawn from four vascular sites in patient P9 (upper panel) and five patients combined (lower panel). The two-sided Wilcox test was used. Data are presented using box and whisker plot (median, lower quartile, upper quartile, minimum, and maximum values). n = 45 cells in HV; n = 12 cells in PA; n = 40 cells in PV; n = 16 cells in PoV. **P < 0.01, ***P < 0.001. Exact P values in upper panel: HV vs PA, P = 1.18 × 10⁻⁹; PA vs PV, P = 2.79 × 10⁻⁴; HV vs PV, P = 2.36 × 10⁻⁴. Exact P values in lower panel: HV vs PA, P = 2.32 × 10⁻³; PA vs PV, P = 7.00 × 10⁻⁴; PV vs PoV, P = 1.50 × 10⁻⁵; HV vs PoV, P = 6.13 × 10⁻³. Bar = median, box plot = quartiles. c Pseudotemporal kinetics of CTCs in patients P9. d Bubble chart presenting the molecular pathways enriched in CTCs from each vascular sites. Hypergeometric test was used to test whether DEGs were overlapped with the gene sets. The Benjamini–Hochberg FDR-controlling method for multiple hypothesis testing were performed.

