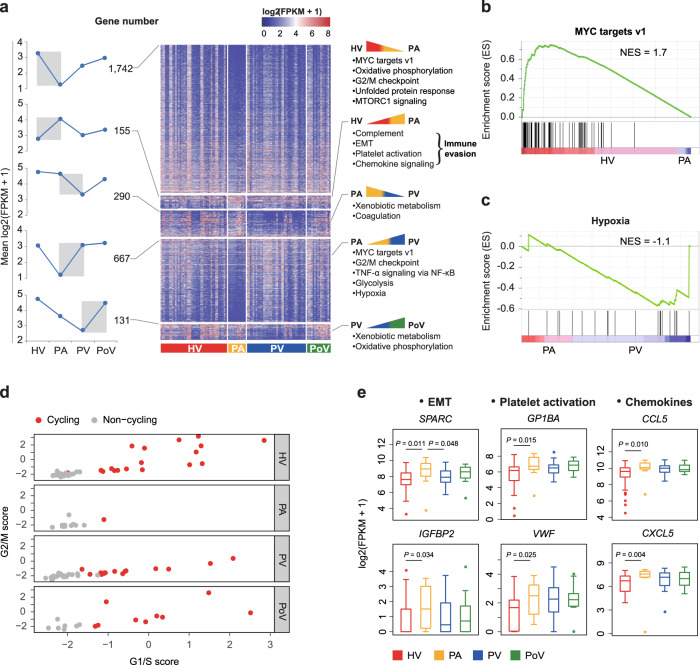
Fig. 3. Dynamics of single-CTC transcriptome highlights pathway alterations for stress response and heterogeneity in cell cycle during circulation.
a Dynamic changes and heat map of differentially expressed genes between neighbor vascular sites (HV vs PA, PA vs PV, and PV vs PoV), with the number of differentially expressed genes indicated at left panel and major signaling pathways enriched (right panel). b GSEA of CTCs from HV vs PA for MYC targets v1 pathway. c GSEA of CTCs from PA vs PV for hypoxia pathway. d Scatterplot indicating cell cycle state of individual CTCs on the basis of G1/S (x-axis) and G2/M (y-axis) gene sets in different vascular compartments. e Box and whisker plots showing expression variance of EMT-related, platelet activation, and chemokine genes in CTCs across four vascular sites. Data are presented as median, lower quartile, upper quartile, minimum, and maximum values. n = 45 cells in HV; n = 12 cells in PA; n = 40 cells in PV; n = 16 cells in PoV. The two-sided Wilcox test was used.

